This is a continuation. Enumerations of tables and figures continuous from Part – I. Explanations for abbreviations etc. could already be in Part – I. For Part – I and – II, the same dataset was used.
Correlation analysis
Simply comparing means does not let us analyze important deviations. Therefore, this section will discuss results from correlation analyses, at first in Table 3 between the different estimations at the cross-national level. The national IQs [DB] show strong positive correlations with all those from Lynn and Vanhanen, with the highest value in case of L&V12 (r=.89; N=108; p<.001). A look in the scatterplot in Fig.3 shows that this relationship is linear. Using a second grade polynomial formula increases r by <.01. IQs from Lynn and Vanhanen are a bit higher for low-IQ nations and lower for high-IQ nations. This might be due to DB’s intensified use of IQ conversions between different Raven’s Matrices forms, which would also explain the higher standard deviation of IQ[DB] relative to IQ[L&V12] in Table 1 and 2 (Part – I).
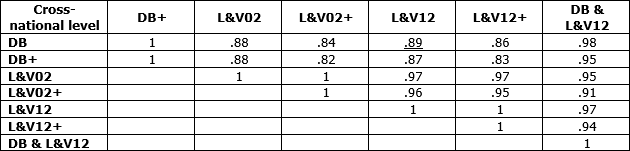
Table 3: Correlation matrix between national IQs by different estimations. Underlined relations in scatterplots. Variable “DB & L&V12” is from unweighted means of both estimates or from the only available estimate when there was only one present. For all correlations, p<.001.
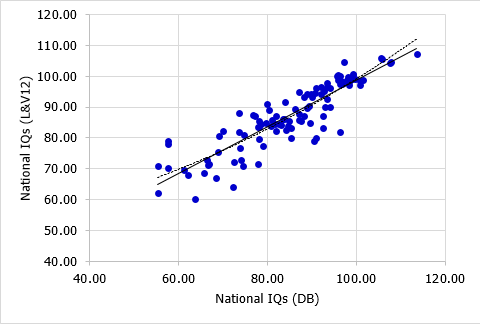
Fig.3: Scatterplot between two estimations of national IQs (DB × L&V12; r(linear)=.89; N=108; p<.001).
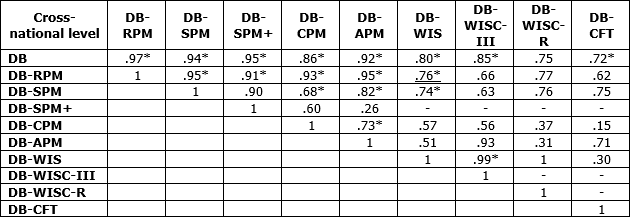
Table 4: Correlation matrix between national IQs[DB] from named tests only. Underlined relations in scatterplots. *p<.001 (N varies). RPM=Raven’s Progressive Matrices (all); SPM=Raven’s Standard Progressive Matrices; SPM+=Raven’s Standard Progressive Matrices Plus; CPM=Raven’s Coloured Progressive Matrices; APM=Raven’s Advanced Progressive Matrices; WIS= Wechsler Intelligence Scales (all); WISC-R=Wechsler Intelligence Scale for Children revisited ed.; WISC-III=Wechsler Intelligence Scale for Children 3rd ed.; CFT=Culture Fair Test.
The correlations between the national IQs [DB] from different tests are strongly positive, especially between tests from the same type (Raven’s Matrices or Wechsler Scales). But between different types, they decrease to a low of .26 (APM × SPM+; N=7; p=.571) or .15 (CPM × CFT; N=10; p<.676). This might be due to error as a consequence of low sample sizes of nations in which estimates from these different tests or test-types are available. Between the two most frequently used test-types, RPM and WIS, the correlation stays strong with r=.76 (N=23; p<.001), also shown in Fig.2. But larger discrepancies between the RPM and WIS can be seen in some cases; the most marked is Egypt (EGY), the red datapoint on Fig. 4. The low WIS score of 43.54 came from a study by Wachs et al. (1995) from a sample of rural children with low SES. This source was rechecked during the writing of this blogpost but no errors in the calculation of IQs could be found. The same source gives a CPM raw score of 14.18 equivalent to a corrected IQ of 56.87 for 8.50y olds, a bit higher than the IQ from WISC-R but also very low for a North African or Middle Eastern nation. The WIS score was the only available such score for Egypt; however, there were other available RPM scores, and the RPM estimate for Egypt as a whole is 82.65. Such outliers will be discussed later, in a special blogpost.
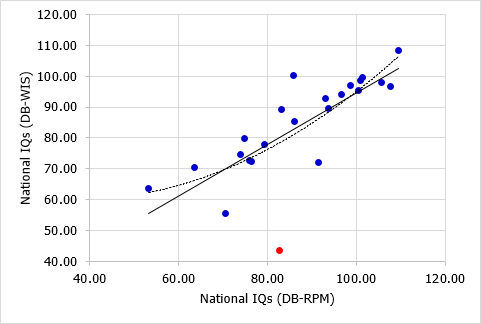
Fig.4: Scatterplot between estimations of national IQs[DB] from two different test-types (RPM × WIS; r(linear)=.76; N=23; p<.001). Red is strongest outlier EGY (M=82.65 vs. 43.54).
A correlation analysis at the cross-sample level allows one to observe relations between IQs from samples and some other properties of the samples. Line one in Table 5 shows that IQs are not significantly related to mean age or size of the samples, and also not to the amount of test-time adjustment (r(linear)=.05; N=566; p=0.435). Such adjustments are necessary to correct estimations of IQs for the FLynn-Effect in the country the used test was standardized (more in later posts). It is one of the most error-prone parts of the methods and criticized by other scientists (Wicherts, Dolan & van der Maas, 2010; Wicherts et al., 2010). But the weak correlation suggests that the adjustments lead to very little error.
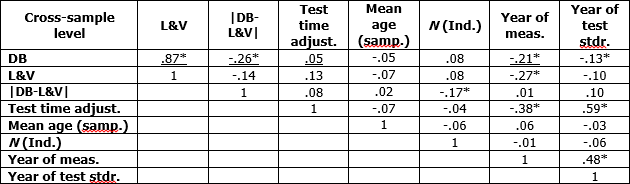
Table 5: Correlation matrix between sample IQs and sample characteristics. Underlined relations in scatterplots. *p<.001.
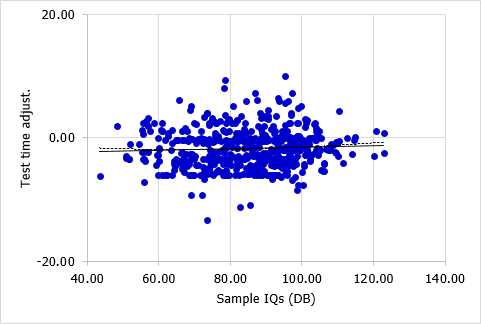
Fig.5: Scatterplot between estimations of sample IQs [DB] and test-time adjustments; r(linear)=.05; N=566; p=.435).
There is a moderate and significant correlation (r=-.21; N=566; p<.001) between sample IQs and years of measurement, together with a weak but also significant correlation (r=-.13; N=566; p<.001) between sample IQs and the year of test standardization. Both sample properties are in turn strongly positively related (r=.48; N=566; p<.001), possibly because more recent studies mostly use more recent standardized tests. A closer look at the correlation between sample IQs and the year of measurement (Fig.6) shows that also an U-shaped regression-line would not increase the correlation noticeably (r(square)=.22).
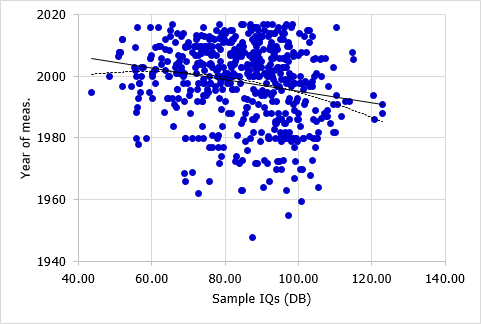
Fig.6: Scatterplot between estimations of sample IQs [DB] and years of measurement; r(linear)=-.21; N=578; p=.435).
Once again, IQs from different estimations [DB; L&V] are very strongly linearly related, as shown in Fig.7 (r(linear)=.87; N=566; p<.001). One extreme outlier was found in this analysis, which is a sample for India (IND) with an IQ[DB] of 120.22 but an IQ[L&V] of 77.00, and the second matches much better to other scores found for this nation (M=81.94 than the first. The sample is from a publication of Gandhi-Kingdon (1996), consisting of government aided children of around 13.50y from urban areas, and the IQs were once again checked as a result of this finding. The source gives two additional samples with IQs [DB] of 70.08 (N=252) and 74.78 (N=290). The third sample, named “PUA” (private unaided) within the source, differs from both others by having much higher scores for education (self and family) and SES, which makes higher scores in Raven’s Tests expectable. The mean age of the PUA sample is 13.60 and the CPM raw score 36.03, converted to a SPM raw score of 52.91 because the age range of the CPM norms (4.00 to 11.00y) does not extend to the PUA samples’ age. This is equivalent to a corrected IQ of 120.22. An error could not be detected and is eventually hidden in inaccuracies of the CPM to SPM conversionLynn and Vanhanen did not split the samples and reported the score of 77.00 for all 928 individuals. By using the same procedure, a corrected IQ [DB] of 88.36 was estimated, which is still 11.36 points above their estimate, but at least closer. As mentioned before, this outlier will be discussed together with some others in a special blogpost later.
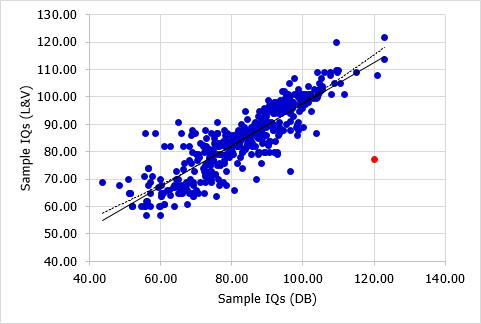
Fig.7: Scatterplot between two estimations of sample IQs [DB × L&V]; r(linear)=.87; N=566; p<0.001).
The last scatterplot in Fig.8 shows the relationship between sample IQs [DB] and the absolute value differences between both estimates of sample IQs [DB; L&V] (r=-.26; N=566; p<.001). The differences were much greater for low-IQ samples and a U-shaped regression line would show a correlation (r=.42) twice stronger than a linear one. This might be due to data quality or to the use of extrapolated IQs from conversion formulas. So far, it is the only pattern for a systematic deviation between both estimations and definitely requires further investigation.
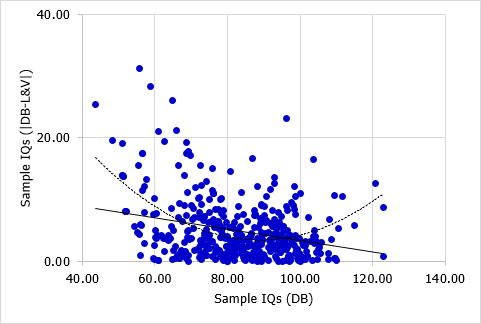
Fig.8: Scatterplot between sample IQs [DB] and absolute differences between two estimations of sample IQs [DB × L&V]; r(linear)=.87; N=566; p<.001).
What’s next?
The further course of this project will follow three major goals. At first, analyses should be done to uncover the causes of deviations between the different estimations of national IQ as well as to find eventual methodological variables that might be responsible for variations in IQs. The second aim is a detailed explanation of the methods used to estimate national and sample IQs (DB), to make all steps and decisions easier to understand and transparent for critics. And last, a sample quality index should be created to evaluate the goodness and validity of the national IQ dataset (both in its entirety and for specific samples), and to evaluate the impact of data quality on estimated national and sample IQs.
Sources and References (Part – I and II)
Central Intelligence Agency (CIA) (2017). The World Fact Book. From: https://www.cia.gov/library/publications/the-world-factbook/
Gandhi-Kingdon, G. (1996). The quality and efficiency of private and public education: A case-study of urban India. Oxford Bulettin of Economics and Statistics, 58, 57-82. doi:10.1111/j.1468-0084.1996.mp58001004.x
Lynn, R., & Vanhanen, T. (2002). IQ and the Wealth of Nations. Westport, CT: Praeger.
Lynn, R., & Vanhanen, T. (2012). Intelligence: A Unifying Construct for the Social Sciences. London: Ulster Institute for Social Research.
Wachs, T. D., Bishry, Z., Moussa, W., Yunis, F., McCabe, G., Harrison, G., … & Shaheen, F. (1995). Nutritional intake and conext as predictors of cognition and adaptive behavior of Egyptian school children. International Journal of Behavioral Development, 18, 425-450. doi:10.1177/016502549501800303
Wicherts, J. M., Dolan, C. V., & van der Maas, H. L. J. (2010). A systematic literature review of the average IQ of sub-Saharan Africans. Intelligence, 38, 1-20. doi:10.1016/j.intell.2009.05.002
Wicherts, J. M., Dolan, C. V., Carlson, J. S., & van der Maas, H. L. J. (2010). Raven’s test performance of sub-Saharan Africans: Average performance, psychometric properties, and the Flynn Effect. Learning and Individual Differences, 20, 135-151. doi:10.1016/j.lindif.2009.12.001