Scientific conferences often start with a greeting to the participants and audience who have traveled long distances around the globe to communicate with, or just listen to, their colleagues. I would like to adhere to this tradition, even if the Internet has significantly shortened the travel time, because this blog has as its aim to communicate with interested people from around the globe about a topic that has a global scale: The IQ of the nations of the world.
IQ is a parameter for intelligence, which can be defined as a “very general mental capability that, among other things, involves the ability to reason, plan, solve problems, think abstractly, comprehend complex ideas, learn quickly and learn from experience.” It “can be measured, and intelligence tests measure it well” and it is of “great practical and social importance” (Gottfredson, 1994).
A trait so important for a huge variety of individual and social phenomena might be able to explain differences existing in many social, political, economic, cultural, and/or biological areas between nations and geographic regions. However, to observe such associations requires the existence of valid figures for the IQs of the world’s nations. This blog aims to present work on national IQ to an unlimited audience.
Ground already covered
In 2002, a book was published that had both a considerable impact on intelligence research and a substantial public reception. The name of this book was “IQ and the Wealth of Nations“, written by the British psychologist Richard Lynn, Professor Emeritus at the University of Ulster, UK, and the Finnish professor of political science at the University of Tampere, Finland, Tatu Vanhanen (†2015), well known for creating the Vanhanen Index of Democratization (Lynn & Vanhanen, 2002; Lynn, 2017; Vanhanen, 2003). One highlight of this book was a list of average national IQs for 185 nations, of which 81 national IQs were collected and calculated directly from studies, the remaining 104 national IQs being estimated from the IQs of nearby and ethnically comparable countries. This list was expanded and improved over time, first in “Race Differences in Intelligence: An Evolutionary Analysis” (Lynn, 2006) next in “The Global Bell Curve: Race, IQ, and Inequality Worldwide” (Lynn, 2008), and finally in “Intelligence: A Unifying Construct for the Social Sciences” (Lynn & Vanhanen, 2012a).
To calculate the national IQs, Lynn and Vanhanen collected IQ test results from samples that were as representative or applicable as possible of/to their respective national populations, and set these results on a scale with the IQ of the UK at 100. This comparison IQ is often called the Greenwich IQ Mean, after Greenwich Mean Time. Some corrections were needed, in the main to adjust for the FLynn Effect, the increase of IQs ascending over time during the 20th century in many nations (Lynn, 1982; Flynn, 1984; Pietschnig & Voracek, 2015). If more than one measurement of IQ was available for a nation, the mean or median was calculated. IQs for other nations for which no measurements could be found were calculated as means of their adjacent nations.
Fig. 1 is based on the 2012 version and shows how the national IQ levels form geographic clusters, with the lowest scores, between 60 and 80, in Sub-Saharan Africa; middling scores, between 80 and 95, mostly in Arabian or Middle Eastern, South Asian, Oceanian and South American nations; high scores, between 95 and 102, in European nations or those with a population descended mostly from Europe; and finally very high scores, above 102, in Northeast Asian nations.
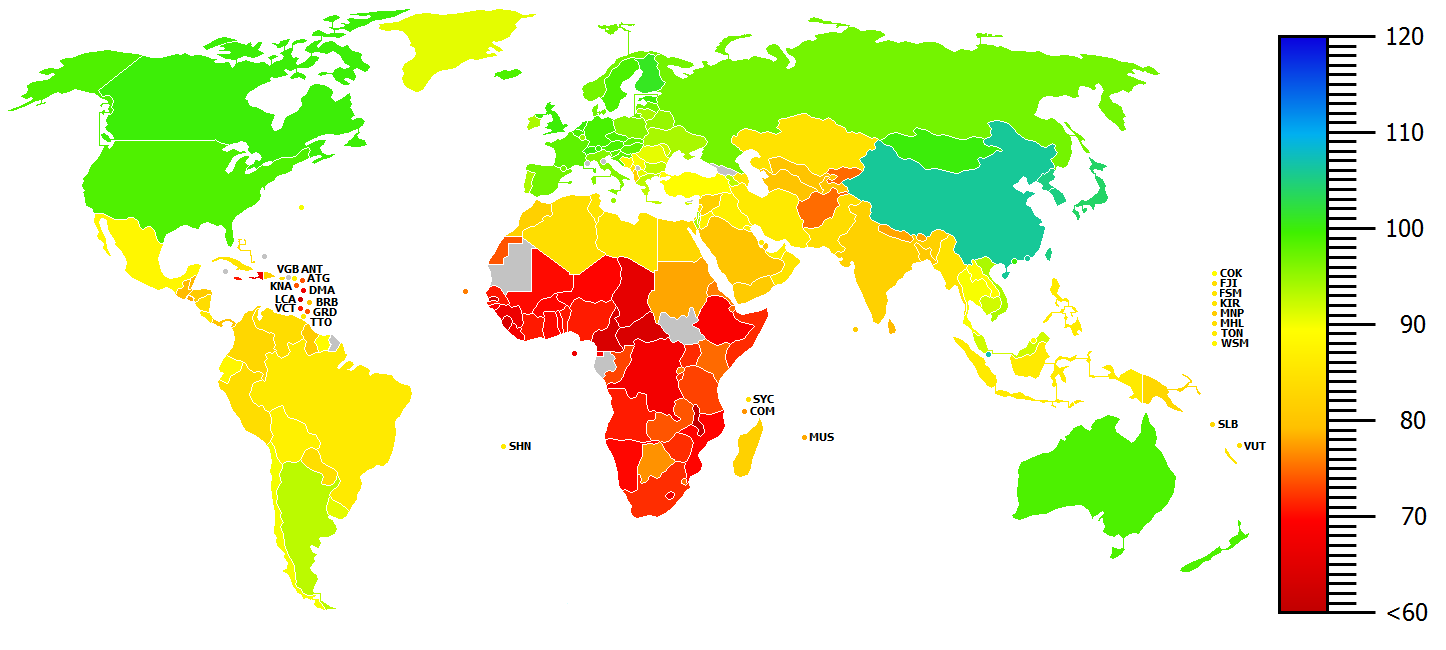
Fig. 1: National IQs as calculated or estimated by Lynn and Vanhanen (2012).
Such a non-random global pattern suggests that national IQs might be related to other unequally distributed factors; indeed, a large amount of significant correlates, summarized by Lynn and Vanhanen (2012b) have been found between national IQs and other international variables. Statistical relations were found between national IQs and variables in the fields of education (e.g. results from school assessment, literacy, etc.); cognitive outputs (e.g. scientific publications, patents, Nobel prizes, etc.); economics (e.g. GDP/c in varying designs, economic growth, income, etc.); politics (e.g. democracy, freedom, corruption, etc.); social behavior (e.g. crime, suicide rate, happiness, modernization, etc.); medicine (e.g. infant mortality, HIV rates, fertility, etc.); geography (temperature, latitude); and anthropology (skin color).
In most cases, correlations were positive for those variables for which higher scores are usually considered desirable, and negative for variables for which lower scores are usually considered undesirable. On average, nations with higher IQs had stronger economies; were healthier, wealthier, and more educated; and were more modernized, politically stable, and peaceful (national suicide rates are an exception: suicides are less common in low-IQ nations). As the map suggests, there are strong positive correlations between national IQs and average skin brightness of a nation’s population (.69 to .92), and between national IQ and a nation’s mean latitude (.68 to .72). More recently, variables from population genetics joined in, such as population frequencies of intelligence-associated SNPs (e.g. Piffer, 2013, 2015), Y-chromosomal haplogroups (Rindermann, Woodley, & Stratford, 2012) or genetic distances in general (León & Burga-León, 2015; Becker & Rindermann, 2016).
Hunt and Sternberg (2006) called the list of national IQs “far from ideal” in a review of Templer and Arikawa’s (2006) paper of correlations between national IQs, skin color, and income. They (Hunt and Sternberg) criticized the non-representativeness of the included samples; Lynn and Vanhanen’s failure to weight the studies for sample size; and the practice of estimating some countries’ IQs from the IQs of nearby and ethnically comparable countries.
Malloy (2013-2014) addressed Lynn and Vanhanen’s work in great detail at the Human Varieties blog. A huge amount of different measurements of IQ were collected for 15 nations or insular areas in Southeast Asia or the Caribbean. Some national means were very close to those from Lynn and Vanhanen; others showed large differences, especially Cambodia. I compared the national IQs from both sources (some numbers listed in the Malloy column were calculated by me from Malloy’s data) in Table 1 and got a correlation of .47 (N = 12; p > 0.050) with and .79 (N = 11; p < 0.001) without Cambodia. On the one hand, these numbers suggest considerable reliability of Lynn and Vanhanen’s results; on the other hand, some ambiguities, errors, and deviations were reported by Malloy, suggesting that Lynn and Vanhanen’s IQs are not as reliable as have sometimes been believed.
| Nation | IQ | Dif. | |
| Lynn and Vanhanen (2012) | Malloy (2013-2014) | ||
| Bahamas, The | 84.00 | 92.52 | -8.52 |
| Bermuda | 90.00 | 92.00 | -2.00 |
| Burma | 85.00 | 97.00 | -12.00 |
| Cayman Islands | n.d. | 75.00 | n.d. |
| Cuba | 85.00 | 90.00 | -5.00 |
| Dominican Republic | 82.00 | 73.14 | 8.86 |
| Haiti | 67.00 | 68.00 | -1.00 |
| Jamaica | 71.00 | 79.00 | -8.00 |
| Laos | 89.00 | 90.60 | -1.60 |
| Puerto Rico | 83.50 | 84.60 | -1.10 |
| Thailand | 89.90 | 93.90 | -4.00 |
| Turks and Caicos Isl. | n.d. | 89.40 | n.d. |
| U.S. Virgin Islands | n.d. | 82.20 | n.d. |
| Vietnam | 94.00 | 91.40 | 2.60 |
| Cambodia | 92.00 | 66.56 | 25.44 |
| r | 0.47 | ||
| p | >0.050 | ||
| r (KHM* excluded) | 0.79 | ||
| p (KHM* excluded) | <0.001 | ||
Table 1: National IQs from Lynn and Vanhanen (2012) and Malloy (2013-2014) compared. *KHM = Cambodia.
Notwithstanding all criticism, Lynn and Vanhanen’s dataset remained the only comprehensive cross-national collection of psychometric IQ measurements. In 2015, a group of scientists corresponded about how to make it more accessible to a larger audience and preserve it for future times. As a participant in this correspondence, I welcomed this idea and saw a lot of potential to expand this intention to a comprehensive open access database of global IQs; however, at the time, I could not guess what scale the project would get. It all started with a simple search for digital copies of all the (or as many as possible of the) sources Lynn and Vanhanen had used, and the cataloguing of these digital copies. As we tried to get a deeper understanding of the methods, we obtained more and more IQ data, so that it became possible to re-estimate some of the IQs Lynn and Vanhanen had calculated.
In May 2017, the first version (0.9) of this project was presented at the London Conference on Intelligence (Becker, 2017). This revision included around 340 recalculations of IQs for 115 nations, around half of the nations in the original dataset. At the time, the revision included only IQs measured by Raven’s Matrices but the correlations to Lynn and Vanhanen’s IQs were .95 at the sample level and .83 at the cross-national level (Fig. 2). In the following months, data from other IQ tests such as the Wechsler tests for children and adults (WPPSI; WISC; WAIS; WASI); the Stanford-Binet Intelligence Scale (SBIS); the Cattell Cultural Fair Tests (CFT); and some others, were added to the dataset. On July 9th, 2017, the NIQ-DATASET version 1.0 was born, followed by version 1.1 on October 22nd with improved calculations and corrections.
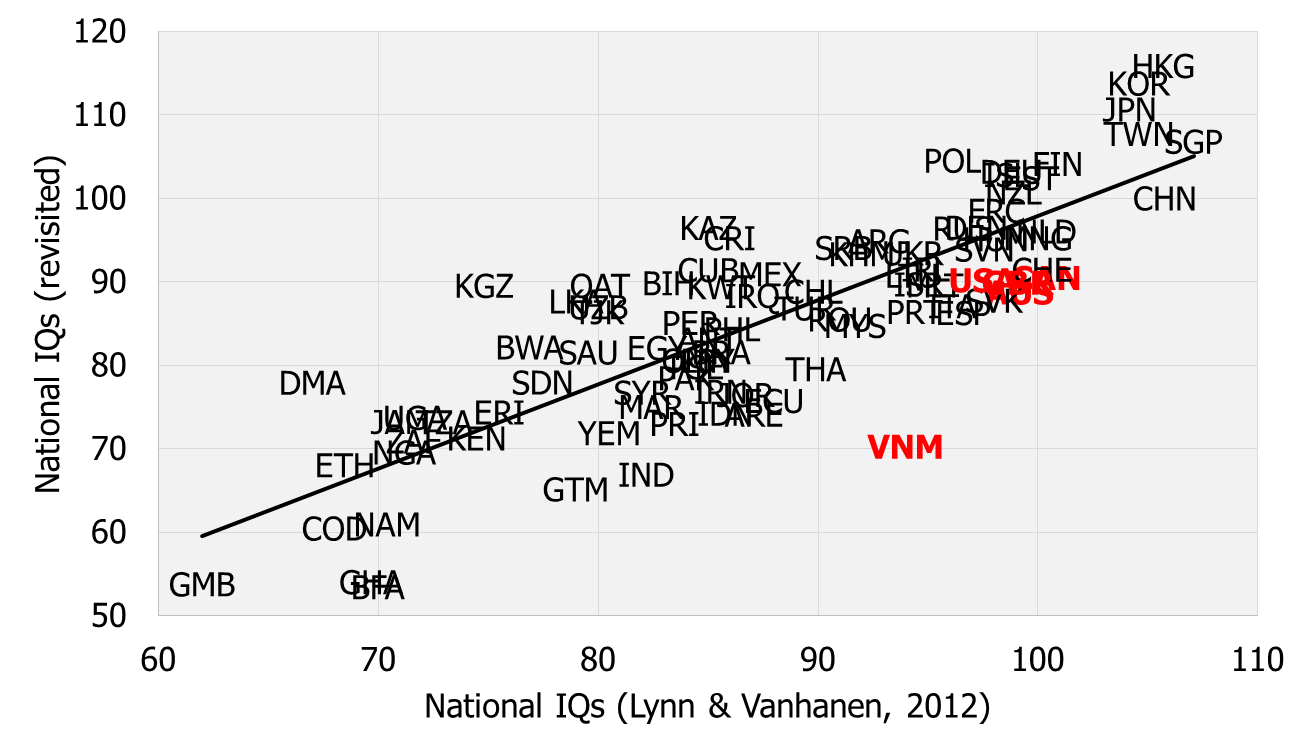
Fig. 2: Scatterplot between original national IQs (horizontal axis) and the new national IQs (vertical axis) (r = .83; N(nat.) = 92; N(samp.) = 691(L&V)|347(rev.); p < 0.001). Red marks debatable cases.
New insights and old problems made the current version 1.2 necessary, which contains some structural changes. This version has calculated IQs for 124 nations (presented in Fig. 3), based on 543 datapoints. A comparison with the national IQs from Lynn and Vanhanen (2012), which unlike the IQs in the present dataset were partially based on international school assessment tests, showed great similarities but also differences. Using version 1.2, a correlation of .87 (N = 445; p < 0.001) was calculated between Lynn and Vanhanen’s estimated IQs and my estimated IQs. For the same datasets; a correlation of .86 (N = 123; p < 0.001) was calculated between Lynn and Vanhanen’s estimated IQs and my estimated IQs for the same nations. Furthermore, I calculated a mean IQ for 124 nations of 84.90 (SD = 12.72) or 88.12 if the nations’ IQs were weighted by population.
Since one of my intentions was to make all the methods for calculations and corrections comprehensible, I started to write a manual, which helped for understanding but turned out to be not suitable to go into all details, to include all ideas, or to help springboard discussions. So, when a post on James Thompson’s blog (Thompson, 2017) was published about this project and gained a lot of attention, praise, and criticism, it gave me the incentive to start a blog of my own. The blog aims to present, explain, and discuss this project in a more detailed way, and to document its progress step by step.
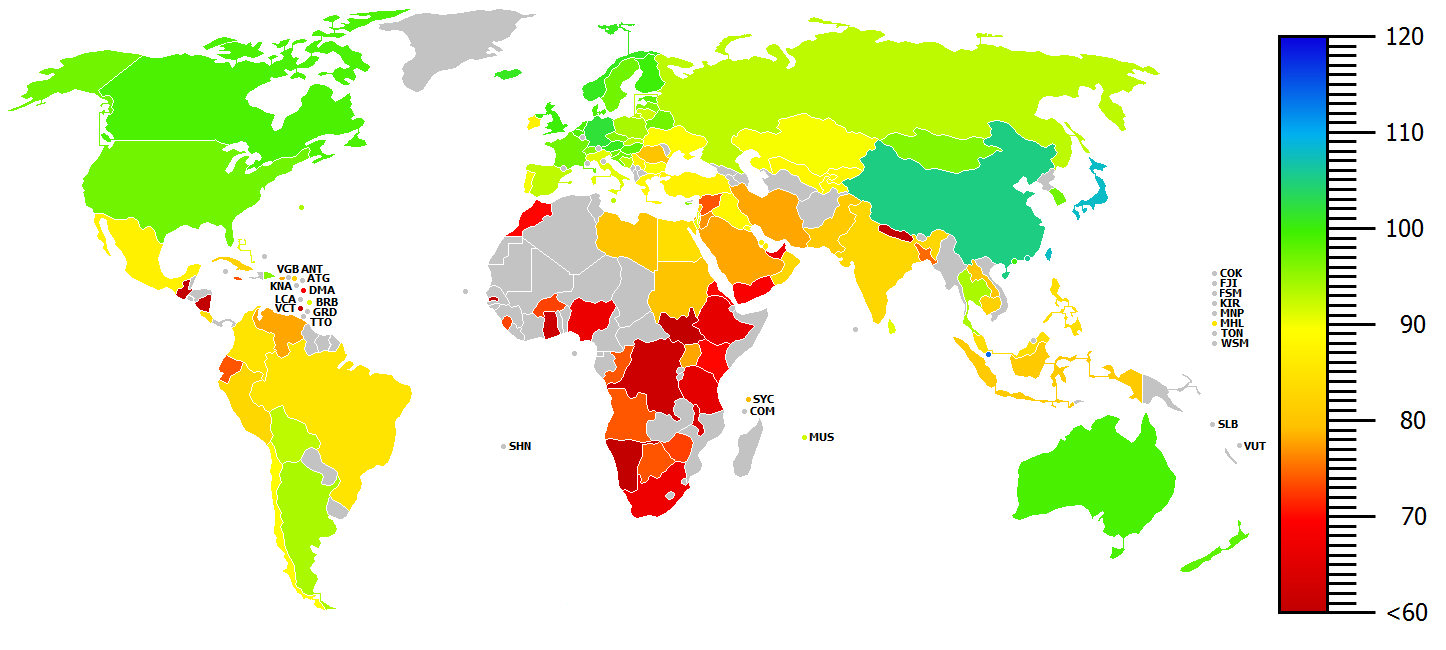
Fig.3: National IQs from the NIQ-DATASET (V1.2).
About the Dataset and Blog
This blog is divided into two sections.
(1) The database section contains the current, as well as all earlier, versions of the National IQ dataset, starting with V1.1. The folders contain the main dataset in an Excel file together with a few notes about methods and updates, and also some additional and changing material, like maps, graphs, etc.
(2) The blog will be used to take a closer look at important issues, findings, and thematically related things, and to allow open discussion. Posts will be published irregularly to document the current state of the national IQ project.
Everything here should follow the principle of an open source project, and not a single number or calculation should be left in the “black box”. Another principle is the use of standardized methods. Special methods for individual cases should be avoided. All uploaded data are available for free use. All this is intended to guarantee clarity and traceability. I hope to meet the needs of interested people as much as possible, and I look forward to readers’ comments and discussions.
With best regards,
David Becker
Sources and References
Becker, D., & Rindermann, H. (2016). The relationship between cross-national genetic distances and IQ-differences. Personality and Individual Differences, 98, 300-310. doi:10.1016/j.paid.2016.03.050
Flynn, J. R. (1984). The mean IQ of Americans: Massive gains 1932 to 1978. Psychological Bulletin, 95, 29-51. doi:10.1037/0033-2909.95.1.29
Gottfredson, L. S. (1994). Mainstream science on intelligence: An editorial with 52 signatories, history, and bibliography. Intelligence, 24, 13-23. doi:10.1016/S0160-2896(97)90011-8
Hunt, E., & Sternberg, R. J. (2006). Sorry, wrong numbers: An analysis of a study of a correlation between skin color and IQ. Intelligence, 34, 131-137. doi:10.1016/j.intell.2005.04.004
León, F. R., & Burga-León, A. (2015). How geography influences complex cognitive ability. Intelligence, 50, 221-227. doi:10.1016/j.intell.2015.04.011
Lynn, R. (1982). IQ in Japan and the United States shows a growing disparity. Nature, 297, 222-223. doi:10.1038/297222a0
Lynn, R. (2006). Race Differences in Intelligence: An Evolutionary Analysis. Augusta, GA: Washington Summit Publishers.
Lynn, R. (2008). The Global Bell Curve: Race, IQ, and Inequality Worldwide. Augusta, GA: Washington Summit Publishers.
Lynn, R. (2017). Personal Homepage. From: http://www.rlynn.co.uk/
Lynn, R., & Vanhanen, T. (2002). IQ and the Wealth of Nations. Westport, CT: Praeger.
Lynn, R., & Vanhanen, T. (2012a). Intelligence: A Unifying Construct for the Social Sciences. London: Ulster Institute for Social Research.
Lynn, R., & Vanhanen, T. (2012b). National IQs: A review of their educational, cognitive, economic, political, demographic, sociological, epidemiological, geographic and climatic correlates. Intelligence, 40, 226-234. doi:10.1016/j.intell.2011.11.004
Malloy, J. (2013-2014). HVGIQ. From: http://humanvarieties.org/
Piffer, D. (2013). Factor analysis of population allele frequencies as a simple, novel method of detecting signals of recent polygenic selection: The example of educational attainment and IQ. The Mankind Quarterly, 65, 168-184.
Piffer, D. (2015). A review of intelligence GWAS hits: Their relationship to country IQ and the issue of spatial autocorrelation. Intelligence, 53, 43-50. doi:10.1016/j.intell.2015.08.008
Pietschnig, J., & Voracek, M. (2015). One century of global IQ gains: A formal meta-analysis of the Flynn Effect (1909–2013). Perspectives on Psychological Science, 10, 282-306. doi:10.1177/1745691615577701
Rindermann, H., Woodley, M. A., & Stratford, J. (2012). Haplogroups as evolutionary markers of cognitive ability. Intelligence, 40, 362-375. doi:10.1016/j.intell.2012.04.002
Templer, D. I., & Arikawa, H. (2016). Temperature, skin color, per capita income, and IQ: An international perspective. Intelligence, 34, 121-139. doi:10.1016/j.intell.2005.04.002
Thompson, J. (2017). The World’s IQ = 86. Test results of 550,492 individuals in 123 countries. From: http://www.unz.com/jthompson/the-worlds-iq-86/
Vanhanen, T. (2003). Democratization: A comparative analysis of 170 countries. London; New York: Routledge.
Wicherts, J. M., Dolan, C. V., & van der Maas, H. L. J. (2010). A systematic literature review of the average IQ of sub-Saharan Africans. Intelligence, 38, 1-20. doi:10.1016/j.intell.2009.05.002
Wicherts, J. M., Dolan, C. V., Carlson, J. S., & van der Maas, H. L. J. (2010). Raven’s test performance of sub-Saharan Africans: Average performance, psychometric properties, and the Flynn Effect. Learning and Individual Differences, 20, 135-151. doi:10.1016/j.lindif.2009.12.001