A new version of the THE NIQ-DATASET (V1.3) is nearing completion. It will be based largely on the same data that already underlie V1.2, but will contain a large amount of new statistical analysis. This blog post summarizes the most important findings. It presents comparisons between different estimates,––such as between Lynn and Vanhanen’s 2002 and 2012 estimates and between the combined results of different IQ tests –– and addresses the most striking outliers. However, a deeper investigation of the reasons for deviations or relationships between the different estimates is planned for later posts. Please keep also in mind that due to some new data and changes in methods, the numbers and findings presented here may differ from those in V1.2.
Some explanations in advance: Abbreviations are used to specify different estimations and tests. The abbreviation “L&V” results from the surnames of Richard Lynn and Tatu Vanhanen, and the numbers “02” and “12” represent the years in which Lynn and Vanhanen’s estimates were published (Thus, L&V02 indicates the national IQ estimates published by Lynn and Vanhanen in 2002). “DB” indicates estimates made by me, David Becker. A “+” always marks estimations which include national IQs calculated not only directly from psychometric measurements but from geographic mean IQs from neighboring nations. Thus, L&V02+ indicates the national IQ estimates published by Lynn and Vanhanen in 2002, including nations for which IQs were calculated by averaging the IQs of neighboring nations. Two levels are observed in the analyses: The cross-national level and the cross-sample level, by which numbers at the the cross-national level based on calculations (mostly means) from data at the cross-sample level.
Database
At the time of writing, the database consists of IQs for 203 nations [DB+], of which 125 were calculated from psychometric measurements of intelligence [DB] from 325 scientific sources (see Table 1), and 78 were calculated from geographic means when no data was available for the nations themselves. The World Fact Book of the CIA (2017) currently lists 267 “world entities”; the [DB] estimates include 46.82% of these, and the [DB+] estimates include 76.03%. This includes also such entities as Hong Kong, the Gaza Strip, Puerto Rico, Greenland, and others; these are not “nations” in the sense of wholly autonomous political entities, but they are often listed separately in cross-national comparisons and their IQs should therefore also be of interest.
Sources are mostly publications in scientific periodicals, reports or books. Sources with samples of doubtful origin or methods were not used; neither were sources that were missing necessary data, such as sample size (N of individuals), mean age, geographic origin of a sample and year of test-administration. A huge amount of additional data was collected from the sources for more accurate tracking of methods and eventually necessary corrections. For example, nearly all of the IQs from Raven’s Progressive Matrices were recalculated from raw scores to avoid irregularities caused by different standardizations. Some of the sources gave more than one sample, and some samples were split into more homogeneous sub-samples to allow specific analyses.
Overall, there are 566 samples included (one overall IQ estimate per sample) encompassing 627,098 individuals. The number may seems high; however, it only accounts for <0.01% of the world’s total population of 7,405,107,650 (CIA, 2017). Possible multiple inclusion of individuals in different samples cannot be ruled out. However, care was taken to not include the same sample twice if published in more than one source, and the geographical and temporal distances between the different test-administrations should make such overlaps unlikely.
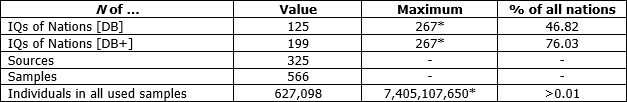
Table 1: Sample sizes in V1.3 on the national and individual levels. *Number of world entities and world’s total population from CIA (2017).
Descriptive statistics
Fig. 1 and 2 survey the geographic distribution of all national IQ scores [DB; DB+], which pattern is similar to that found by Lynn and Vanhanen (2002; 2012) and described in the earlier post. The purpose of Table 2 is to give a more detailed look into the data at the cross-national level. According to the dataset, the mean IQ weighted by national populations is 88.17 [DB] or 88.16 [DB+]. These means are similar to those found by Lynn and Vanhanen in 2002 (89.30 or 88.00) and 2012 (83.71 or 89.73), and the standard deviations are also similar.
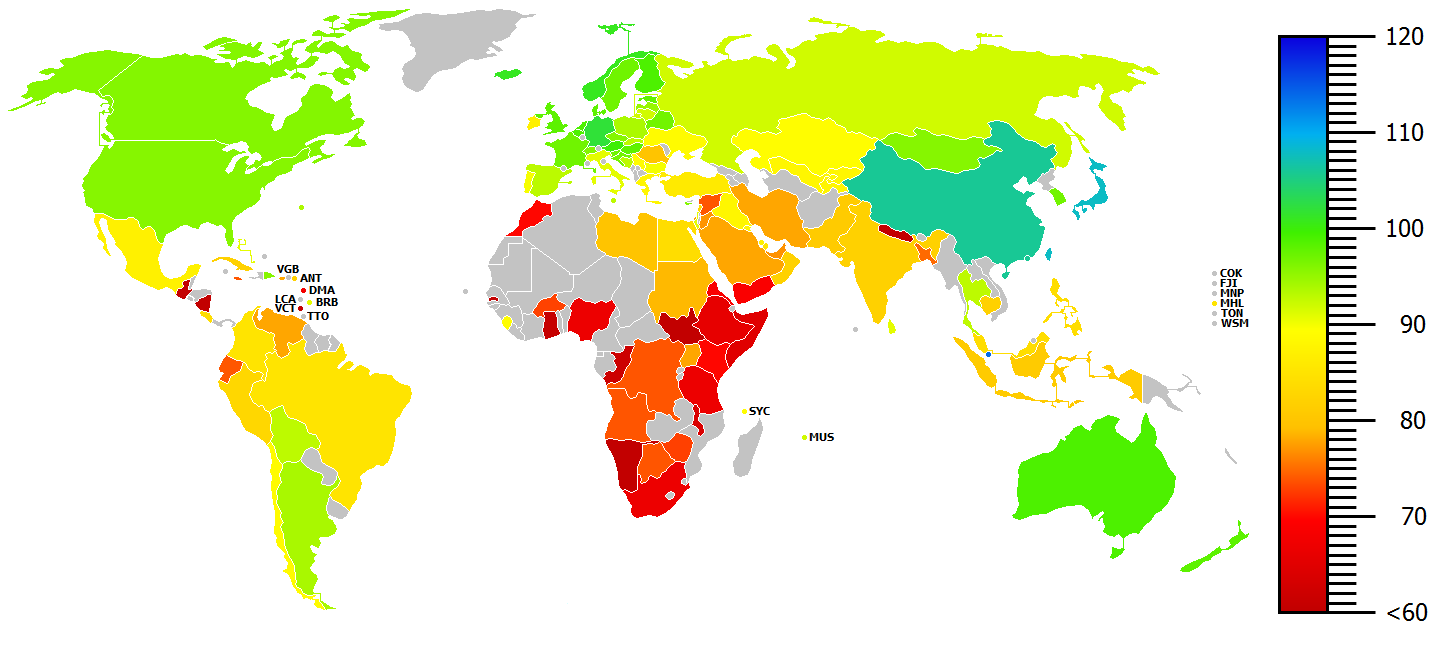
Fig.1: National IQs [DB] from THE NIQ-DATASET (V1.3) (M=84.74; SD=12.79; N=125). Data from psychometric tests only.
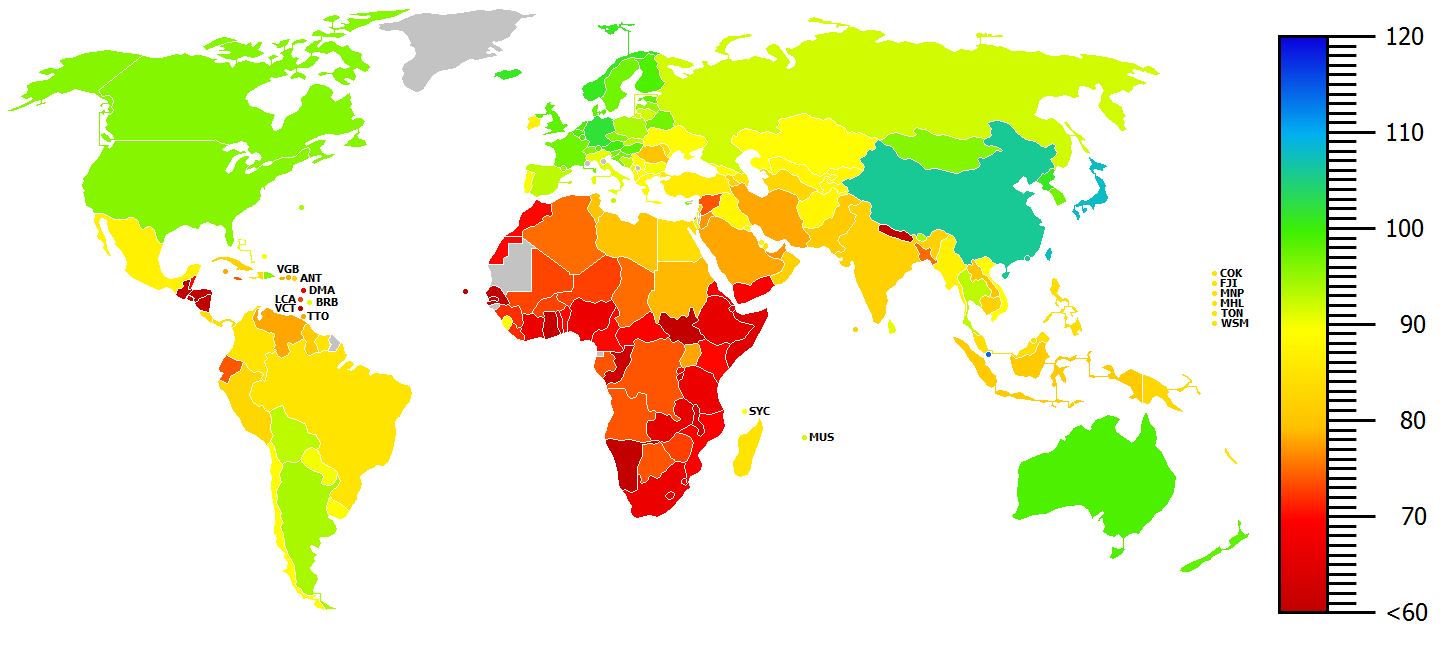
Fig.2: National IQs [DB+] from THE NIQ-DATASET (V1.3) (M=82.57; SD=12.50; N=199). Data from psychometric tests and geographic means.
For IQ[DB] and IQ[DB+], the nation with the lowest estimated score is Nicaragua (NIC) with 53.69, an implausible value that should be treated with caution. It does not make sense considering the IQs of nearby and culturally or ethnically similar nations; nor does it fit Nicaragua’s economic and educational status. Unfortunately, Nicaragua is neither included as a case with psychometric measured IQ in one of the L&V estimations, nor into the international school assessment tests PISA or TIMSS, and can therefore not be validated. The highest IQ score for Nicaragua found within a sample is 63.63, which seems more realistic but more should not be speculated here. In the L&V estimations, the nation with the lowest estimated IQ is Equatorial Guinea (GNQ) with 59.00 in 2002 or Malawi (MWI) with 60.10 in 2012. It should be noted, that the score of GNQ was wrongly attributed to GNQ and the value thus a mistake, as noted by Wicherts, Dolan & van der Maas (2010). On the other hand, the East Asian political entities Hong Kong (HKG) and Singapore (SGP) obtained the highest IQ scores in both the present database and the L&V12 database. For Singapore, these are 113.67 [DB; DB+] and 107.10 [L&V12; L&V12+]. For Hong Kong, these are 105.90 [DB; DB+] and … [L&V12; L&V12+]. In 2002, Lynn and Vanhanen estimated an IQ for Hong Kong of 107.00, which is very close to DB’s estimate of 105.90. The last line of Table 2 shows a combination of the two estimations DB and L&V12, for which a simple mean was calculated if scores were available for both variables; otherwise, the only available score was taken.
In lines 2 to 10 a breakdown of IQ[DB] is made for different tests. These are the Raven’s Progressive Matrices (RPM) in their standard (SPM), standard-plus (SPM+), colored (CPM) and advanced (APM) version. For Wechsler Intelligence Scales (WIS), only the two specific tests for children WISC-R (Wechsler Intelligence Scale for Children––Revised, the second edition) and (WISC-III) (the third edition) are listed. At least, the Culture Fair Test (CFT) is also separated. Results from many other tests like the Kaufman Assessment Battery for Children (K-ABC), the Stanford-Binet Intelligence Scales (SBIS), or other Wechsler tests (including the WAIS, the WPPSI, and other editions of the WISC) are included in the dataset but not shown below due to the low number of estimates that use these tests. Overall, separated results are very close to each other, except those from the CFT, which are around 10 IQ points higher. Deviations might be caused by case selection. There are 26 national IQs measured by the CFT from which 22 are for Western or European nations plus Hong Kong. For this reason, the standard deviation of the CFT scores is comparatively low.
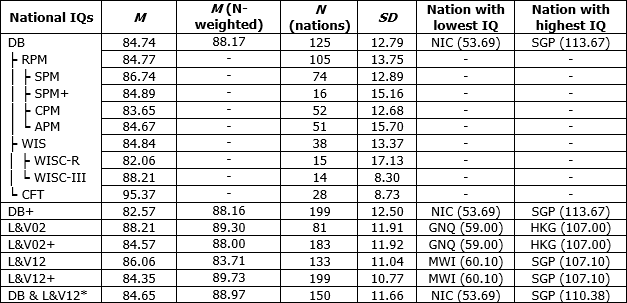
Table 2: Descriptive statistics for national IQs by different estimations at the cross-national level. Country-codes: ISO 3166-1 ALPHA-3; *Unweighted means of both estimates or the only available estimate. Only tests with N(nations)≥10 separated: RPM=Raven’s Progressive Matrices (all); SPM=Raven’s Standard Progressive Matrices; SPM+=Raven’s Standard Progressive Matrices Plus; CPM=Raven’s Coloured Progressive Matrices; APM=Raven’s Advanced Progressive Matrices; WIS= Wechsler Intelligence Scales (all); WISC-R=Wechsler Intelligence Scale for Children revisited ed.; WISC-III=Wechsler Intelligence Scale for Children 3rd ed.; CFT=Culture Fair Test.
Similar pattern can be seen in Table 3 for the cross-sample level. Means and standard deviations are close to those from the cross-national level. The differences between the global means from DB and L&V (available for 450 samples up to 2016) is only 0.03, and the mean of the absolute value differences between both estimations is only 5.00 with a standard deviation of 5.15. This means that a majority of 64% of the DB estimations are less than 5 IQ points away from the L&V estimations.
Sources and References (Part – I and II)
Central Intelligence Agency (CIA) (2017). The World Fact Book. From: https://www.cia.gov/library/publications/the-world-factbook/
Gandhi-Kingdon, G. (1996). The quality and efficiency of private and public education: A case-study of urban India. Oxford Bulettin of Economics and Statistics, 58, 57-82. doi:10.1111/j.1468-0084.1996.mp58001004.x
Lynn, R., & Vanhanen, T. (2002). IQ and the Wealth of Nations. Westport, CT: Praeger.
Lynn, R., & Vanhanen, T. (2012). Intelligence: A Unifying Construct for the Social Sciences. London: Ulster Institute for Social Research.
Wachs, T. D., Bishry, Z., Moussa, W., Yunis, F., McCabe, G., Harrison, G., … & Shaheen, F. (1995). Nutritional intake and conext as predictors of cognition and adaptive behavior of Egyptian school children. International Journal of Behavioral Development, 18, 425-450. doi:10.1177/016502549501800303
Wicherts, J. M., Dolan, C. V., & van der Maas, H. L. J. (2010). A systematic literature review of the average IQ of sub-Saharan Africans. Intelligence, 38, 1-20. doi:10.1016/j.intell.2009.05.002
Wicherts, J. M., Dolan, C. V., Carlson, J. S., & van der Maas, H. L. J. (2010). Raven’s test performance of sub-Saharan Africans: Average performance, psychometric properties, and the Flynn Effect. Learning and Individual Differences, 20, 135-151. doi:10.1016/j.lindif.2009.12.001