Preface
The publication of the book written by Richard Lynn and me (Lynn & Becker, 2019) and of V1.3.2 of the NIQ-dataset got a lot of attention and feedback. I’m very grateful for any positive or negative comments as they help me to further improve my work. Although I wanted to release the next version later and with more progress, some of the feedback forced me to rush forward to V1.3.3. I would like to use the release of this latest version to respond to some of the most common critiques and questions. The most important of these should be discussed here. My special thanks go to Ronald Henss and Jared Huggins, who have pointed out a series of mistakes and errors, which could then be corrected.
The very low NIQ scores for some countries were the most criticized aspect. Overall, there were nine countries in V1.3.2 in which measured NIQ scores fell below 60. According to the International Statistical Classification of Diseases and Related Health Problems, such scores would be within a range (70-35) classified as indicators for a mild or moderate mental retardation (ICD-10 F70-F79) (DIMDI, 2012). However, Jensen (1989, p.367-369) showed that Black children in the USA with an IQ<70 showed less abnormal behaviour than white children with comparable scores, which raise doubts about the universality of this rule for populations with different ethnic backgrounds. Critics also pointed out that much higher scores were reported for the same countries by Lynn and Vanhanen (2012) and even these have previously been criticized as “too low” by Wicherts, Dolan and van der Maas (2010).
Four questions arise at this point: (1) Why are there such significant differences between IQs estimated by Lynn and Vanhanen and in the NIQ-dataset? (2) Would it be possible that a country has a population with a mean IQ in a range <70 or even <60? (3) How meaningful are the results, provided by the available tests, in such a low range? (4) Would have IQ differences in that range implications in the real-world? In the further course I would like to try to give some answers.
Causes of IQ-differences between datasets
Table 1: List of countries with NIQ<60 in V1.3.2
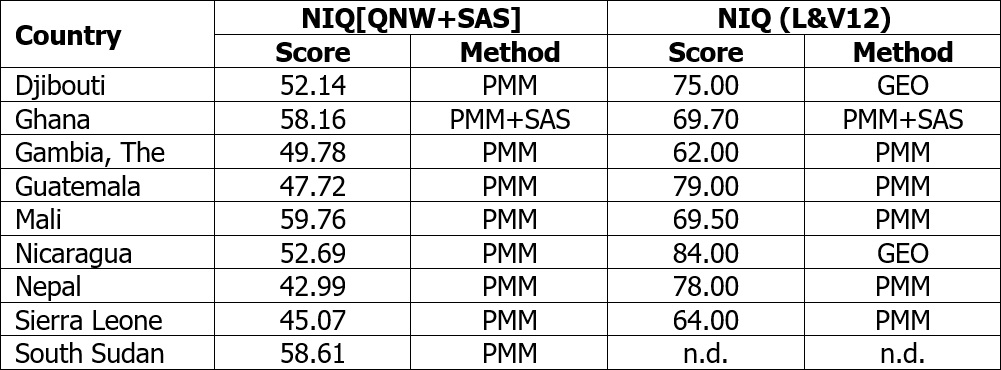
Notes: “PMM” = from psychometric measurements; “SAS” = from school assessment studies; “GEO” = means of neighboring countries
The first question can actually be answered very quickly: One of the major differences between the methods of Lynn and Vanhanen and those used in the NIQ dataset is the use of conversion formulas to convert raw to IQ scores in the case of the Raven’s Matrices. These formulas also take into account variations in the IQ scores <60, whereas Lynn and Vanhanen used the norm tables in the Raven’s Manuals for conversion, which do not go in areas below the 0.10 or 1.00 BP (British Percentile) respectively below IQs of 55 or 60. To clarify this issue, Fig.1 shows an excerpt of the SPM norms from the British standardization in 1979, taken from Raven (2000, Table B1). If two samples, both with a mean age of 7 years, would obtain mean raw scores on the SPM of 9 (blue) and 6 (red), both samples would be at the 1.00 BP and equivalent to an IQ of around 65, despite their raw score difference of 3 points.
Fig.1 British norms (1979) for SPM (excerpt)

Source: from Raven (2000, Table B1)
In contrast, the formulas used in the NIQ-dataset describe the relationship between raw and IQ scores as shown by the trendline and formula in Fig.2. This made it possible to extrapolate above or below the ranges covered by the norm tables. By applying the formula displayed in Fig.2, a raw score of 9 would now be equivalent to an IQ score of 69.37 whereas a raw score of 6 would now be equivalent to an IQ score of 53.93.
Fig.2 Relationship between SPM raw scores and IQ scores for 7 years olds in the British norm sample from 1979
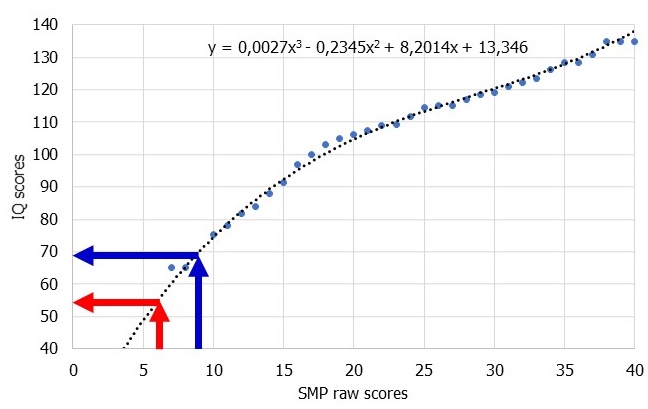
Notes: Blue dots represent numbers from the norm table (Raven, 2000, Table B1); dotted line represents trend according to formula displayed; blue and red arrows represent relationships at 6 and 9 raw scores
The use of the above-mentioned method, in particular the exceeding of the norm range of the tests, can be criticized. In the following, I would therefore first like to disclose its effects by detailed description of the calculations for some real low-IQ countries.
Ghana is an interesting case, since this country participated in TIMSS 2003, 2007 and 2011 (Martin, Mullis & Foy, 2008; Martin et al., 2012, 2014; Mullis, Martin & Foy, 2008; Mullis et al., 2004, 2012) and therefore one of the few Sub-Sahara African countries in international school assessment studies at all. It obtained mean scores of 250.45 in 2003, 284.99 in 2007 and 300.96 in 2011. By transforming these scores, by mean and standard deviation of the United Kingdome, IQ equivalents of 48.62, 55.33 and 60.11 are the results. The average score of 54.69 is much closer to the country’s psychometric NIQ of 61.63 in V1.3.2 than to the psychometric IQ of 70 from Lynn and Vanhanen. This shows that an NIQ<60 would be quite conceivable.
The three sources for Gambia, with two samples per source available, all used Raven’s Matrices, one times the SPM and two times the CPM (Alderman et al., 2014; Jukes & Grigorenko, 2010; Jukes et al. 2006). On the SPM, raw scores were 14.50 and 14.65, on the CPM, raw scores were between 8.34 and 9.29. However, all six samples aged 17 to 20 years and were therefor above the age range of 6 to 16 years and 4 to 12 years for which the tests used are intended (Raven, 1981, 2008a). After conversions to the scale of the APM according to Raven, Raven and Court (1998, Table APM34) and Raven, Raven & Court (2006, Tab.26), all these scores would be below an APM raw score of 1.00 and therefore below the 0.38s BP, were the norm stables stopped. As a result, Lynn gave the samples an IQs of 60 to 64 and the V1.3.2 between 45.96 and 55.57.
Similar applies to Guatemala. Here, we have seven samples from four sources (Calderon & Hoddinott, 2010; Stein et al., 2005; Choudhury & Gorman, 1999; Martorell et al., 2005), six measured wit SPM and one with the CPM. Once again, in case of the six samples measured with SPM, sample ages were above the age range of 6 to 16 years, with 17 to 38 years, and had to be transformed to the APM scale, which result in raw scores below 1 and IQs between 33.29 and 53.68. In contrast, the sample measured with the CPM had a mean age of around 8 years which makes a conversion into another Raven’s scale redundant. The CPM raw score of 18.43 is equivalent to an IQ score of 69.25 and very close to the estimate of 70 by Lynn and Vanhanen. The discrepancy between the IQ scores, which resulted from transformation into APM scale, and the one from the CPM administration could indicate that the very low scores result from the APM transformation. However, the CPM sample is also different in age and it can not be ruled out that such age differences in intelligence exist in Guatemala actually.
The NIQ dataset has only one sample for Mali (Dramé & Ferguson, 2017), which has not been used by Lynn and Vanhanen. However, the NIQ score is 59.76, close to 60 and therefore less problematic.
Within the three samples available from Nicaragua, two were tested by CPM and one by the WISC-IV. On the WISC-IV, a FS-IQ of 67 was reported directly and corrected for FLynn-Effect to 63.48 (Rodríguez, 2012). IQs from the CPM are 49.75 and 54.86 and therefore much lower, but had to go through a whole series of conversions. Sandiford et al. (1997) reported a CPM raw score of 8.24 for a sample of females which completed primary school and had an age of around 35 years. However, the source reported that only the Set AB was applied. According to Raven, Raven and Court (2006, Tab.8), a raw score of 8.24 on Set AB would be equivalent to a raw score of 23.00 to 24.00 on the full CPM. Since the age of the sample was above the CPM norms, this score had to be transformed to 23.00 to 25.00 on the SPM scale and this to 1 to 3 on the APM scale. By using the conversion formulas, the APM raw score is 1.79, equivalent to an IQ of 55.91. A second sample of females which not completed primary school get, after the same calculations, an APM raw score of 0.45, equivalent to an IQ of 50.80. Lynn and Vanhanen estimated an IQ of 84 for Nicaragua but only by the geographic mean. Although the Wechsler IQ is eleven or 16 points above the CPM and also clearly above the limit of 60, it is still 17 points below the geographic average. Problems with the large number of necessary conversions and transformations could also be a cause here for the very low scores.
For Nepal, four sources gave scores for overall nine samples, all measured with the CPM (Buckley et al., 2013; Christian et al., 2010; Jamison & Lockheed, 1985; Jamison & Moock, 1984). All samples obtained IQs<60 and with between 38.90 and 51.20 some of the lowest scores calculated within the whole dataset. Once again, as in the case of Nicaragua, the high ages made transformations to SPM and APM necessary again. Reported CPM raw scores are between 12.98 and 17.78. The transformation to the SPM scale, based on information of Raven, Raven and Court (2006, Tab.26), did not change this range and on the APM scale, all raw scores are <1. In contrast to Nicaragua, there is no evidence that only one or two sets of the CPM were administered. Reported standard deviations are between 4 and 6, which indicated the use of the whole CPM. Jamison and Lockheed (1985) named the test used “Raven’s Progressive Matrices”. At first it was not clear which Raven’s Test was used, even if an item range from 0 to 36 was given. This could have meant that the APM or an abridged version of the SPM had been used. However, Jamison and Moock (1984) cited the manual of the CPM and since there is a common author and the structure and content of both studies are very similar, this rather indicates the use of CPM in both.
The study of Berry (1966) is the only source for intelligence in Sierra Leone. It reported CPM scores of 13.10 and 13.90 for two samples with mean ages of 25 years. Applying the same procedure as described for Nicaragua and Nepal, APM scores would be <1 and IQ scores 44.64 and 46.38. The discrepancy between the NIQ score and the one from Lynn and Vanhanen is almost 20 scores. The source reported that the “coloured series A, Ab, and B was administered untimed; maximum score: 36.”
South Sudan was not listed as a separate country by Lynn and Vanhanen (2012) due to its, at that time, recent independence. This has the positive effect that the measurements available to this country are all quite up to date, with years of administration between 2009 and 2017, however they all consist of refugee children. Sources are Ahmed et al. (2017) and Osman et al. (2017a, 2018). Two samples were measured with the SPM but have to be split into four since the ages reached up to 17 years and thus beyond the intended range of the SPM. Sample one has a mean age of 10.50 years with a range from 6 to 15 years. Raw scores were given for ten age groups and on average 13.80. According to the SPM norm table this score would be below the 1st BP and an IQ of <65. The application of the conversion formula results in an IQ of 59.57. However, in the NIQ-dataset the IQs were calculated for the ten age groups separately and were between 61.79 at the age of 9 and 72.02 at the age of 8, averaged to 66.33. The same procedure applicated on sample two, with a mean age of 11 and a range from 7 to 15 years, gives a mean raw score of 13.17, which would be again below the 1st BP and an IQ of <65 according to the norm table and 63.43 by formula. Again, in the NIQ-dataset the IQs were calculated for age groups separately and were between 59.67 at the age of 14 and 77.21 at the age of 7, averaged to 65.66. The two hereof separated sub-samples have mean ages of 17 with ranges from 16 to 18 and SPM raw scores of 20.54 and 22.27 were therefore converted to 0.33 and 1.01 on the APM scale, equivalent to IQs of 53.17 and 56.16 or 53.52 and 56.19 if age groups were handled separately. An additional sample had a mean age of 6.5 years with a range from 6 to 7 and scored on average 13.79 on the CPM, which would be at the 9th BP and equivalent to an IQ of 80 according to the norm table, or 78.67 according to conversion formulas. The higher score of the fifth sample might be caused by its lower age, since it is known that in in developing countries, IQs are lower in higher ages due to a delayed rate of cognitive development (Bakhiet et al., 2018).
Many of the transformations and corrections applied in the NIQ dataset could be potential causes of errors. E.g. it could be argued that the two- to three-step transformations make the final results so low. What would happen if the matter were approached much more cautious? This should be checked on the sample with the ID “NPL1673” from Nepal. It has a mean age of 19 years and obtained a CPM raw score of 12.98, rounded to 13 for the sake of simplicity. 19 years is far above the highest age of the CPM norms but still not in an age range where cognitive backward development is significant. So, if we applied the CPM norms of the highest age group, the 11-12 years old, the raw score of 13 would be, according to the norm table (Raven, 2008a, Table A.1), equivalent to the 0.10 BP and an IQ<60. By transforming the CPM raw score of 13 to the SPM scale (Raven, Raven & Court, 2006, Table 26), it would be 12, which in turn would be below the 1.00 BP if norms of the highest age group of the SPM, the 15-16 years old, was used (Raven, 2000, Table B1). If the SPM+ was used instead the APM, a SPM raw score of 12 would be equivalent to an SPM+ raw score of 9 (Raven, Raven & Court, 1999, Table 10). Now, we can use the age group of the 18-19 years old that fits well to the sample. However, once again, the SPM+ raw score is in the range of the 0.10 BP and therefore below an IQ of 55 (Raven, 2008b, Table A.1). A CPM raw score could also be obtained on only two of the three sets of the CPM, even if there are no notifications about this in the sources. 13 CPM raw scores on sets A and AB would be equivalent to 17 on the full CPM. By using the same procedure as before, a CPM raw score of 17 would be on the 2.00 BP of the CPM norms for 11-12 years olds, equivalent to an IQ of around 69, which is much higher but still relatively low, equivalent to an SPM raw score of 16 and below the 0.10 BP for the SPM norms of the 15-16 years old, and 12 on the scale of the SPM+ and equivalent to an IQ<55 for the age group of the 18-19 years old on the SPM+. So, even if no or other transformations would be used or generous assumptions would be made, the IQ would always be similarly low.
Are mean country IQs in very low ranges conceivable?
All the examples above show that the NIQ scores <60 are most likely not based on errors in the calculation or interpretation of the numbers and methods mentioned in the sources.
So, the next question is, how credible are such scores? There are two ways to test this: (1) empirically by comparing them with scores from other and independent measurements, and (2) verifying the accordance of estimated NIQ scores and real-life phenomena within the countries and societies.
For the first approach, it can be referred to results from international school assessment studies (SAS), presented for all countries with an NIQ[SAS]<70 in Table 2 and converted into Greenwich IQ scores. All the national SAS-IQs are clearly below the psychometric NIQs which would rather be an indication of a psychometric overestimation. Meanwhile, the correlation between both IQ estimates is still positive (r=.68; N=7; p=.093), albeit in a slightly lower magnitude than in the groups of all countries (r=.78; N=82; p<.001). TIMSS and PIRLS do not measure intelligence directly, but skills and knowledge acquired by schooling in the fields of mathematics, sciences (TIMSS) and in reading (PIRLS). Thus, a significant positive effect of higher quality of national educational systems, in particular “international differences in student competence, including the amount of preschool education, student discipline, quantity of education, attendance at additional schools, early tracking, the use of centralized exams and high-stakes tests, and adult educational attainment”, was assumed by Rindermann and Ceci (2009) as well as distorting effects due to the factors literacy, extracurricular education (e.g. by parents or family in general), time in school and the general education level of the population by Rindermann (2006). But to explain the difference between the two measuring methods by differences in learning and living conditions would be premature, since effects of quantity and quality of schooling on Raven’s Test results are also documented (Falch & Massih, 2011; Ahmadpoura & Mujembari, 2015), as well as effects of parental education (Rindermann & Carl, 2017). Additionally, suboptimal living conditions, as they are normal in developing countries for large parts of the population, may influence performances on Raven’s tests too, e.g. psychological burdens due to living in poverty and bad nutrition (Mani et al., 2013; Whaley et al., 2003). Although at this point the Ecological Fallacy prevents us from the conclusion that psychometric and SAS-IQs at the cross-national level are similar affected by the same factors, the argument is strong enough to consider this possible.
Table 2 Compared NIQs from school assessment studies and psychometric measurements for countries with NIQ[SAS]<70
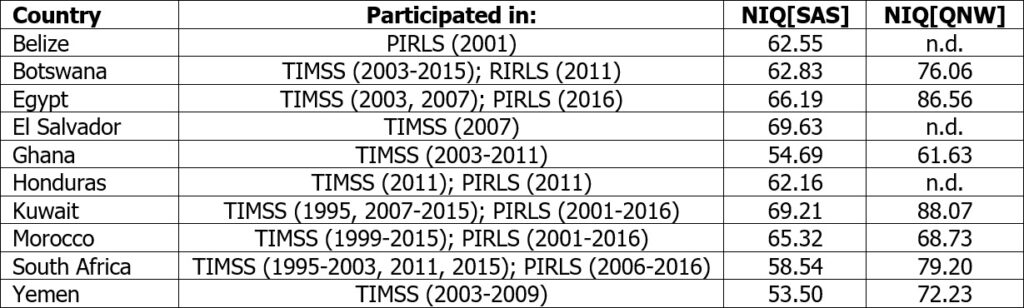
Notes: NIQ[SAS]: M=62.46; SD=5.52; NIQ[QNW]: M=76.07; SD=9.50; rNIQ[SAS]↔NIQ[QNW]=.68; N=7; p=.093; Sources for NIQ[SAS]: Beaton et al. (1997); Martin et al. (1997, 2000, 2004, 2012); Mullis et al. (1997, 2000, 2003, 2004, 2007, 2012a,b, 2016a,b,c,d, 2017); Mullis, Martin & Foy (2008)
For approach number two, descriptions of the degree of rational thinking, defined as the ability to find ways for successful problem solving in a certain situation (Rescher, 1993, 109-143) and which should prevail in societies with allegedly low IQ and form their cultural phenotypes, are appropriate. There is evidence from Piagetian cross-cultural psychology (PCCP) (Hallpike, 1979), that individuals in pre-modern societies are more similar to children in modern societies in terms of cognitive status and therefore rational thinking (Lurija, 1982; Oesterdiekhoff, 2013), which implies a certain correspondence between ontogenetic cognitive development of individuals and phylogenetic cultural development of populations (Oesterdiekhoff, 2012a,b, 2016). In conclusion, individuals in low-IQ countries should tend more often to decisions that do not lead to the intended goal or to modes of behavior and thinking that contradict reason, especially since tests used by Piaget or in PCCP and IQ tests as Raven’s both measured, though in different ways, abstract and logical thinking.
The human rights organization Under The Same Sun collected various reports about tens of thousands of cases of persecution, witchcraft judgments, tortures and ritual murders on albinos in Tanzania, Burundi, Malawi, Mozambique and the Democratic Republic of Congo and even the sale of their body parts to African leaders, due to deep-rooted cultural myths about the conferral of special powers through the use of these body parts in magical rituals (Redfern, 2010; Masakhwe, 2009; Baker, 2017). A recent news story published by the BBC on June 7th 2019 reported that in Mozambique, five bald men were beheaded because the murders thought they had gold hidden in their heads, which could then extract by the use of magical powers, and a police spokesman was cited: “Our preliminary conclusion indicates that the phenomenon is due to cultural beliefs.” Also heads of state, who are often well-educated and should be in the upper cognitive ranks, show such a behavior. The former Gambian President Yahya Jammeh claimed to be able to cure AIDS by rubbing in a “green herbal paste onto the ribcage of the patient” (The Associated Press, 2007). The former President of South Africa, Jacob Zuma, had sex with a person he knew she was HIV positive and thought it could prevent him from infection by “showered immediately after having sex” (Evers, 2007), and Zuma’s predecessor Thabo Mbeki, which for a while led the Ministry of Health, portray medicine used in antiretroviral therapies as ‘poison’ and supported alternative traditional medicines instead (Nattrass, 2008).
The collection of curious news can not provide a representative picture of the situation and quantifications are required. In Nigeria, traditional believes as animism and voodoo are far more common than e.g. in Germany and caused real-life consequences, as traffic accidents, persecution and murder for witchcraft, spread of diseases as HIV and AIDS, and many believe that “God is able to put money inside a person’s empty pocket” or gives a god-believing person an age above 140 (Rindermann, Falkenhayn & Baumeister, 2014). From Ghana it has been reported that, depending on the region of residence, 16 to 48% of the people believe that witchcraft as the mean cause for spreading AIDS, surprisingly with higher percentages in people with primary and secondary education than in those with no education (Tenkorang et al., 2011). A study about superstitious beliefs in Mali reported that 97% of the asked sample believe that the order twins leaving the womb of their mother define their ranks in the family, 95% that dogs crying repeatedly due to the sight of ghosts, 90% that members of the Bozo and Dogon ethnicities should not marry each other, 88% that a not circumcised male is unable to see the Komo-spirit and 78% that a woman who is unable to see this spirit is damned to die, 58% that looking into a mirror while raining causes thunder strikes and so one (Dissa et al., 2017). Also here, real-life consequences in health and wealth are reported and the level of education seems not to affect the prevalence of these beliefs significantly.
Of course, even in Western societies irrational believes are still present, e.g. in the field of homeopathy, were, for example, a survey from Germany in 2014 reported that 60% of the asked people have used homeopathic medicine at least once and 48% of those that the treatment had always the desired effect plus 39% which answered that it helped them sometimes (de Sombre, 2014). However, the search for newspaper reports from Germany, Sweden or Poland about beheadings due to the refusal of eating globules remained so far unsuccessful. The question of intensity and orthodoxy by which such ideas are held and practiced with real-life consequences by a large share of a population must be asked.
60 or 70?
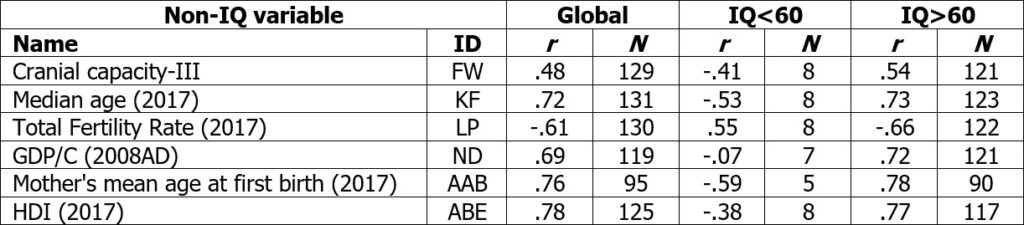
The credibility of the NIQ scores <60 or <70 must be evaluated independently from the credibility of the variances that occur in this area. If these variances describe real differences in intelligence rather than measurement errors, correlations to non-IQ variables would have to be found within the group of NIQ<60 and <70 countries, as they occur on the global scale. This was tested in Table 3a and b.
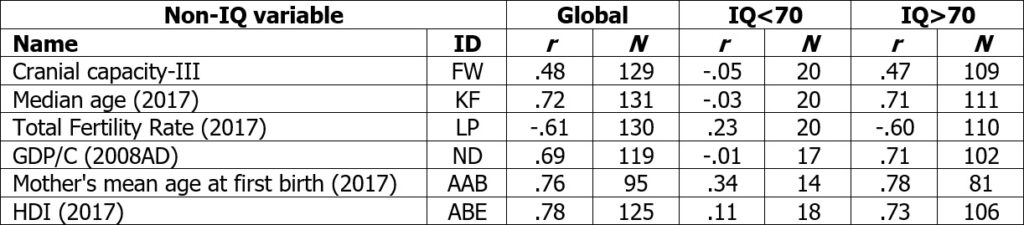
In 3a, six non-IQ variables, which generally show very strong correlations to NIQ and whose data are also available in sufficient numbers for countries of the group NIQ<60, were selected and correlated with NIQ[QNW]. The use of the SAS-IQs was therefore omitted, as there were too few countries in the group of NIQ<60 available and we also wanted to put the focus on the psychometric measurements, because only here the above-mentioned problems appeared. The pattern found is remarkable. All correlations from the global scale changed their direction if countries with an NIQ>60 were excluded. Even more, the correlations in the group of NIQ>60 increased in strength in five of six cases. This is congruent with findings in Lynn and Becker (2019, Chapter 2), where many correlations became stronger when all IQs of all countries NIQ<60 were corrected to 60. This is a strong indicator that the variances in the range NIQ<60 are actually more of a measurement error than real differences in intelligence. However, this is not fully clarified, as it may be that in poor developed countries the relations between intelligence and non-IQ variables may indeed be different than in more developed countries. Aluko and Ajayi (2017) showed that some correlations with NIQ show the same direction in 25 countries from sub-Sahara Africa as on the global scale, e.g. with income (r=.59), financial openness (r=.46) and institutional quality (r=-.37), however some other correlations disappeared, e.g. with latitude (r=-.02) and democracy (r=-.04).
Table 3a Cross-national correlations between NIQ[QNW] and non-IQ variables on the global scale and two sub-samples, separated at IQ=60
The analysis was repeated in Table 3b with separation at the threshold of 70 instead of 60. The pattern of Table 2a largely vanishes, suggesting that there are real variances in intelligence in the range <70, which would be erroneously removed by correcting the results. Moreover, more than twice as many states are affected as before. In conclusion, a threshold of 60 would have to be considered more appropriate than a threshold of 70.
Table 3b Cross-national correlations between NIQ[QNW] and non-IQ variables on the global scale and two sub-samples, separated at IQ=70
In conclusion, there is some evidence that the NIQ variances in the range of <60 reflect no real differences in intelligence between countries and may be caused by the low validity of the tests in this range, whereas that is not the case in the range of <70. Nevertheless, a deeper analysis would be needed to establish a definitive threshold.
A flexible solution
As long as this ambiguity exists problem of very low IQs should therefore be addressed flexibly and the circumstance was used at the same time to realize another intention. V1.3.3 now includes a complex feature for filtering and correction that allows each user to set a set of individual rules for using/not using and correcting samples. It can be found within the primary file in the table [SET]. Figure 3 shows a section of it.
Fig.3 Screenshot from the new table [SET]in V1.3.3
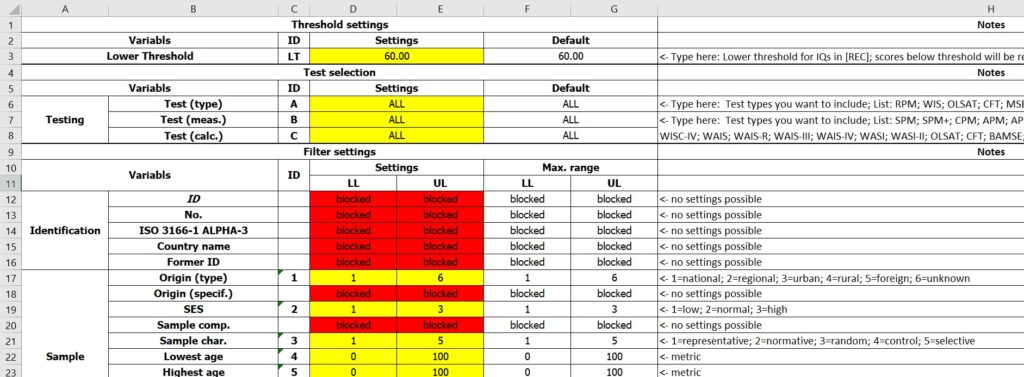
The yellow colored cells can be used to define a set of criteria for correction and filtering. Both, corrections and filterings, are executed exclusively at the sample level and the numbers at the national level were calculated from numbers of the filtered set of samples. Here is a brief description of how the new feature can be used.
At first, in line 3 column D+E, a score can be defined as a lower threshold of IQ. This means that, if for example a score of “60.00” was entered, IQs of all samples (and the IQ from school assessment studies) <60.00 were set to 60.00, whereas a score of 65.00 will remain 65.00. No samples will be excluded here, no matter which setting is made. The corrections only affect the variable [IQ (cor.)] in table [REC] and the variable [IQ (SAS)] in [NAT]. “60.00” is also the default score which from now on is usually used in the entire dataset.
Lines 4 to 8 can be used to define which tests should be integrated. E.g. if “RPM” is typed in cell 6/DE, all samples which were not measured with a Raven’s Test will be excluded. If “WISC-IV” is typed in cell 7/DE, all samples which were not measured with the WISC-IV will be excluded. And if “CPM” is typed in cell 8/DE, all samples will be excluded on which the CPM was not used to calculate IQ scores.
From line 9 onwards, lower and upper boundaries can be defined for 32 metric or ordinal variables. E.g. if “10.00” is typed in cell 24/D and “20.00” is typed in cell 24/E, only samples will be used which mean ages are between 10 and 20 years. The maximum ranges of each variable are shown in columns F and G. In the case of ordinal variables, the column H gives information about the meaning of each condition. E.g. if “3” is typed in cell 17/D and “4” is typed in cell 17/E, only samples will be used which are defined as of urban or rural origin. However, a combination of regional (2) and foreign (5) sample origins is not possible at the time.
The lower threshold should be used here immediately. The question is to what extent certain correlations change when the threshold adopts different values. Table 4 correlates the same non-IQ variables with NIQ[QNW] as Table 2 but always on the global scale and with thresholds increasing from “0.00” along “55.00”, “60.00”, “70.00” until “80.00”. Fig. 4 shows in which countries the first sample was affected when thresholds increased. Please note that the USA and Canada are therefore affected because samples of some ethnic groups (e.g. Blacks; Native Americans) show IQs significantly lower than the country mean. From thresholds of “0.00” to “60.00”, the magnitudes of the correlations in Table 3 increased but start to stagnate or decline at “70.00”. If a threshold of “80.00” was set, all correlations stagnated or decline strongly. At the same time, the global IQ of 86.55 increase slightly to 86.69 at a threshold of “60.00” but after that, take significantly bigger steps to 87.22 at “70.00” and 88.84 at “80.00”. For this reason, “60.00” has been selected as the default value.
Table 4 Cross-national correlations between NIQ[QNW] and non-IQ variables for different settings of lower thresholds
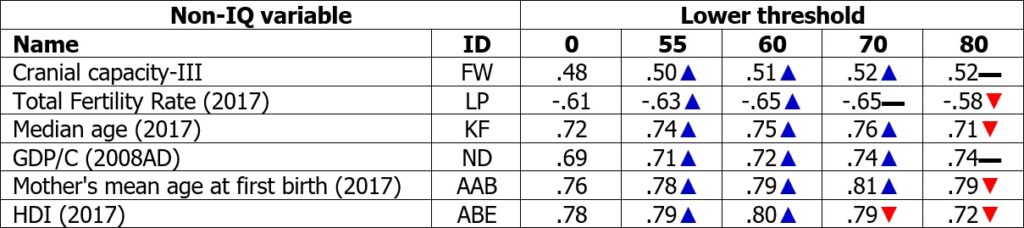
Notes: Number of countries are stable
Fig.4 Countries affected by lower limits
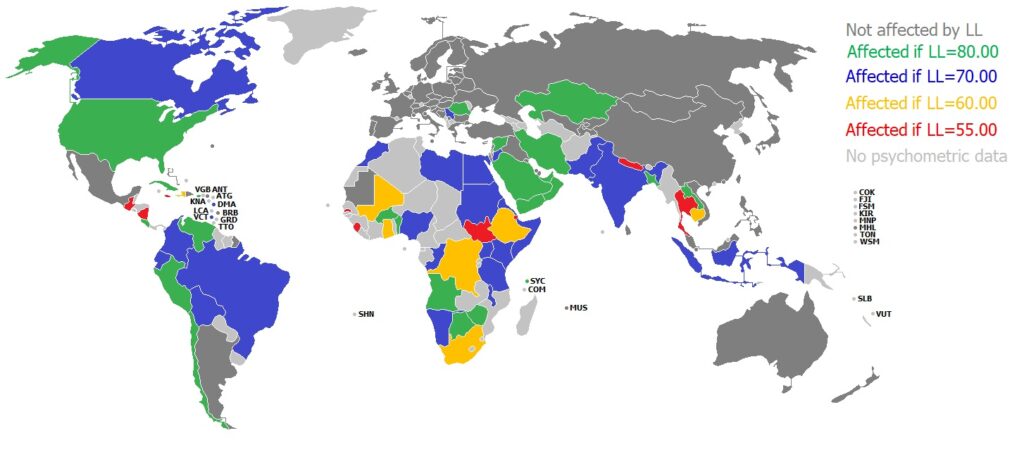
Notes: A colour represents the first threshold which affects at least one of the samples used for a country
Changes from V1.3.2 to V1.3.3 in detail
The implementation of the feature for filtering and correction made some changes in the main file necessary. Some variables in tables [REC] and [SEL] were changed from texts to numbers. This recoding affected the variables [SES], [Sample char.], [Domain], [Procedure], [Country of std.], [Recalc.?], [Special calc.?] and [Test-conv.? ]. The meanings of the numbers which replaced the former text entries are explained in the manual and in the table [SET], column H. Variable [Greenwich cor.], which was a placeholder until then, was replaced by [Below threshold?] and now shows an “1” if a samples [IQ (cor.)] was changed by the threshold set, or “0” if not. The new variable [Test (type)] shows the test family (e.g. Raven’s Matrices, Wechsler Scales, Stanford-Binet) used for measurement. The table [SEL] is now working as the mechanics behind the filter.
I was informed of a bigger mistake concerning the calculation of population weighted IQ averages in tables [NAT] and [FAV], line 212. The formula used to calculate these scores was faulty, since it includes the country-populations only of nations with IQ-data in the numerator, but of all nations in the denominator, which reduced the overall world mean significantly if IQ-data were not available for each country in the list. I corrected the formula so it just takes into account population sizes from nations with IQ-data. As a result, die GLOBAL IQ on table [INF] increased from 81.98 to 86.55. Although, this mistake had no effect on individual country values and statistics, it has to be mentioned separately, since the GLOBAL IQ is the score that becomes visible firstly when using the data set.
Since I got several inquiries about which of the many different IQ variables was most appropriate, I also decided not to use NIQ[QNW] as before, but NIQ[QNW+SAS] as the GLOBAL IQ. The second has the much higher data quality because it is rechecked by the results from international school assessment studies. For this reason I would also like to recommend to anyone who prefers the quality rather than the quantity of data to fall back on NIQ[QNW+SAS]. Only those who want to achieve the highest possible number of cases should fall back on the variable NIQ[QNW+SAS+GEO], which includes the added IQs calculated via means of neighboring countries.
Further corrections were minor and listed in the file CHANGELOG (V1.3.2.1).txt. These concerned mostly occasional values for the non-IQ variables and some samples without leading to significant changes. Furthermore, all references were reviewed again and unified the citation style.
Another new table [CNC] (Cross-National Correlates) has been added. It contains a collection of calculated cross-national correlations from published studies that use the IQ scores from Lynn and Vanhanen or from the NIQ dataset. Most of these numbers were collected by Lynn and colleagues. However, I have tried to confirm as many as possible by the original sources and have added some missing. Additionally, I summarized similar variables to one. These are presented as bold entries from line 3 to 450, whereas all lines below contain each coefficient from each source. This table is still under construction and will be improved and expanded in the future.
Greenland now has its own NIQ, taken from a study by Weihe et al. (2002). Block Designs and Digit Span forward and backward from the WISC-R were administered to a sample of mercury exposed Inuit children in Thule. Since Digit Span is recommended by the WISC-R manual as a good test for finding effects of brain disease, which could be caused by mercury, and is normally not used to calculate FS-IQ (Wechsler, 1974, pp.7-8), only scores from Block Designs were used. Here, a mean raw score of 18.90 was reported. According to the WISC-R norms from 1972 in the USA, this score would be equivalent to a scaled score of 11 and an IQ of 105. 7.82 points have to be subtracted for FLynn-Effect, because measurement took place in 1995, and 2.50. because the norms are from the USA. Therefore, the final IQ would be 94.68, relatively high but in the range (78-96) of those reported for Arctic people by Lynn (2006, Table 11.1).
Closing remarks
I feel compelled to make two clarifications. The whole NIQ-project is based on quantitative methods, therefore it is not very suitable for the determination of individual cases. In particular, it is not appropriate to compare two single countries. What is more important is how close their NIQ scores are to each other. It is more suitable for showing global patterns and accordingly should not be misused for other purposes. There was also criticism regarding a missing peer review of the data and methods I used. I agree that this is a weak point, however the reason why I decided to make this project in an open-source style and with software that is widely used, which offers many more people the opportunity to gain insight into the work as it would ever be possible through a peer review in a journal. And as shown above, this contributes significantly to the improvement.
At the end, a short roadmap for the future of this project should be presented. There are still a lot of sources not integrated in the dataset, due to not yet integrated test types, unresolved problems with the reported findings, or simply for lack of time. This huge bunch of publications should be processed gradually. Recently, I got US norms for various Wechsler Scales. At the moment, German norms were mostly used to convert raw or scaled scores to IQ. These should be gradually replaced as the English-language versions of the tests are more widely used. I have received some inquiries about the standard deviations within the samples. So far, the NIQ dataset only shows the standard deviations of the means of samples per country. In order to change this, a further review of all sources is necessary as the required data has never been collected. However, it is not clear to what extent this will succeed. Many sources report standard deviations only for raw or IQ scores or neither. I am also looking forward to the results of the PISA 2018 volume, which will be published around December this year.
References
Ahmadpoura, N., & Mujembari, A. K. (2015). The impact of montessori teaching method on IQ levels of 5-Year old children. Procedia – Social and Behavioral Sciences, 205(9), 122-127.
Ahmed, A. S. F., Osman, H. A., Bakhiet, S. F. A., Cheng, H., & Lynn, R. (2017). Gender Differences on the Standard Progressive Matrices of South Sudanese Living in Khartoum. Mankind Quarterly, 58, 2.
Alderman, H., Hawkesworth, S., Lundberg, M., Tasneem, A., Mark, H., & Moore, S. E. (2014). Supplemental feeding during pregnancy compared with maternal supplementation during lactation does not affect schooling and cognitive development through late adolescence. American Journal of Clinical Nutrition, 99, 122-129.
Aluko, O. A., & Ajayi, M. A. (2017). Deteminants of banking sector development: Evidence from Sub-Saharan African countries. Borsa Istanbul Review, 20, 1-18.
Baker, Ch. (2017, September 22nd). The trade in body party of people with albinism is driven by myth and international inaction. Retrieved from: https://www.independent.co.uk/life-style/health-and-families/witchcraft-albino-trade-body-part-human-rights-un-sub-saharan-african-a7958946.html
Bakhiet, S., Dutton, E., Ashaer, K., Essa, Y., Blahmar, T., Hakami, S., & Madison, G. (2018). Understanding the Simber Effect: Why is the age-dependent increase in children’s cognitive ability smaller in Arab countries than in Britain? Personality and Individual Differences, 122, 38-42.
Beaton, A. E., Mullis, I. V. S., Martin, M. O., Gonzalez, E. J., Kelly, D. A., & Smith, T. A. (1997). Mathematics Achievement in the Middle School Years: IEA’s Third International Mathematics and Science Study. Chestnut Hill, MA: TIMSS & PIRLS International Study Center, Boston College.
Berry, J. W. (1966). Temne and Eskimo perceptual skills. International Journal of Psychology, 1, 207-229.
Calderon, M. C., & Hoddinott, J. (2010). The inter-generational transmission of cognitive abilities in Guatemala. International Food Policy Research Institute.
Choudhury, N., & Gorman, K. (1999). The relationship between reaction time and psychometric intelligence in a rural Guatemalan adolescent population. International Journal of Psychology, 34, 209-217.
de Sombre, S. (2014). Homeopathic medicines 2014. Notoriety, use and image. [Homöopathische Arzneimittel 2014. Bekanntheit, Verwendung und Image.] Bonn: Allensbach. Retrieved from: https://www.bah-bonn.de/bah/?type=565&file=redakteur_filesystem/public/Ergebnisse_Allensbach_deSombre.pdf
DIMDI (2012). Kapitel V – Psychische und Verhaltensstörungen (F00-F99). Retrieved from: https://www.dimdi.de/static/de/klassifikationen/icd/icd-10-gm/kode-suche/htmlgm2013/block-f70-f79.htm
Dissa, Y., Adjouro, T., Traore, A., & Yorote, A. (2017). A case study of the effects of superstitions and beliefs on Mali socioeconomic development. International Journal of African and Asian Studies, 30, 71-80.
Dramé, C., & Ferguson, Ch. J. (2017). Measurements of Intelligence in sub-Saharan Africa: Perspectives Gathered from Research in Mali. Current Psychology, 2017, 1-6.
Evers, M. (2007, June 8th). The Difficult Struggle Against AIDS in Africa. Retrieved from: https://www.spiegel.de/international/world/epidemic-of-ignorance-the-difficult-struggle-against-aids-in-africa-a-485715.html
Falch, T., & Massih, S. S. (2011). The effect of education on cognitive ability. Economic Inquiry, 49(3), 838-856.
Hallpike, C. R. (1979). Foundations of Primitive Thought. Oxford: Clarendon Press.
Jensen, A. (1998). The g factor. The Science of Mental Ability. Westport: Praeger.
Jukes, M. C. H., & Grigorenko, E. L. (2010). Assessment of cognitive abilities in multiethnic countries: The case of the Wolof and Mandinka in Gambia. British Journal of Educational Psychology, 80, 77-98.
Jukes, M. C. H., Pinder, M., Grigorenko, E. L., Smith, H. B., Walraven, G., & Bariau, E. M. (2006). Long-term impact of malaria chemoprophylaxis on cognitive abilities and educational attainment: Follow-up of a controlled trial. PLoS Clinical Trials, 19, 1-8.
Lurija, A. R. (1982). Cognitive development. Its cultural and social foundations. Harvard: University Press.
Lynn, R., & Becker, D. (2019). The Intelligence of Nations. London: Ulster Institute for Social Research.
Lynn, R., & Vanhanen, T. (2012). Intelligence: A Unifying Construct for the Social Sciences. London: Ulster Institute for Social Research.
Lynn, R. (2006). Race Differences in Intelligence. Augusta, GA: Washington Summit Publishers.
Mani, A., Mullainathan, S., Shafir, E., & Zhao, J. (2013). Poverty impedes cognitive function. Science, 341, 976-980.
Martin, M. O., Mullis, I. V. S., Beaton, A. E., Gonzalez, E. J., Smith, T. A., & Kelly, D. A. (1997). Science Achievement in the Primary School Years: IEA’s Third International Mathematics and Science Study. Chestnut Hill, MA: TIMSS & PIRLS International Study Center, Boston College.
Martin, M. O., Mullis, I. V. S., Gonzalez, E. J., Gregory, K. D., Smith, T. A., Chrostowski, S. J., Garden, R. A., & O’Connor, K. M. (2000). TIMSS 1999 International Science Report – Findings from IEA’s Repeat of the Third International Mathematics and Science Study at the Eighth Grade. Chestnut Hill, MA: TIMSS & PIRLS International Study Center, Boston College.
Martin, M. O., Mullis, I. V. S., Gonzalez, E. J., & Chrostowski, S. J. (2004). Findings From IEA’s Trends in International Mathematics and Science Study at the Fourth and Eighth Grades. Chestnut Hill, MA: TIMSS & PIRLS International Study Center, Boston College.
Martin, M. O., Mullis, I. V. S., & Foy, P. (2008). TIMSS 2007 International Science Report: Findings from IEA’s Trends in International Mathematics and Science Study at the Fourth and Eighth Grades. Chestnut Hill, MA: TIMSS & PIRLS International Study Center, Boston College.
Martin, M. O., Mullis, I. V. S., Foy, P., & Stanco, G. M. (2012). TIMSS 2011 International Results in Science. Chestnut Hill, MA: TIMSS & PIRLS International Study Center, Boston College.
Martin, M. O., Mullis, I. V. S., Gonzalez, E. J., & Chrostowski, S. J. (2004). Findings From IEA’s Trends in International Mathematics and Science Study at the Fourth and Eighth Grades. Chestnut Hill, MA: TIMSS & PIRLS International Study Center, Boston College.
Martorell, R., Behrman, J. R., Grajeda, R., & Hoddinott, J. (2005). The human capital 2002–04 study in Guatemala: A follow-up to the INCAP longitudinal study 1969–77. Food & Nutrition Bulletin, 26, 1-120.
Masakhwe, Ph. W. (2009, September 1st). Africa: Persons with Albinism are Facing Real Threat to Life. Retrieved from: https://allafrica.com/stories/200909010901.html
Mullis, I. V. S., Martin, M. O., Beaton, A. E., Gonzalez, E. J., Kelly, D. A., & Smith, T. A. (1997). Mathematics Achievement in the Primary School Years: IEA’s Third International Mathematics and Science Study. Chestnut Hill, MA: TIMSS & PIRLS International Study Center, Boston College.
Mullis, I. V. S., Martin, M. O., Gonzalez, E. J., Gregory, K. D., Garden, R. A., O’Connor, K. M., Chrostowski, S. J., & Smith, T. A. (2000). TIMSS 1999 International Mathematics Report – Findings from IEA’s Repeat of the Third International Mathematics and Science Study at the Eighth Grade. Chestnut Hill, MA: TIMSS & PIRLS International Study Center, Boston College.
Mullis, I. V. S., Martin, M. O., Gonzalez, E. J., & Chrostowski, S. J. (2004). Findings From IEA’s Trends in International Mathematics and Science Study at the Fourth and Eighth Grades. Chestnut Hill, MA: TIMSS & PIRLS International Study Center, Boston College.
Mullis, I. V. S., Martin, M. O., & Foy, P. (2008). TIMSS 2007 International Mathematics Report: Findings from IEA’s Trends in International Mathematics and Science Study at the Fourth and Eighth Grades. Chestnut Hill, MA: TIMSS & PIRLS International Study Center, Boston College.
Mullis, I. V. S., Martin, M. O., Foy, P., & Arora, A. (2012a). TIMSS 2011 International Results in Mathematics. Chestnut Hill, MA: TIMSS & PIRLS International Study Center, Boston College.
Mullis, I. V. S., Martin, M. O., Gonzalez, E. J., & Kennedy, A. M. (2003). PIRLS 2001 International Report: IEA’s Study of Reading Literacy Achievement in Primary Schools. Chestnut Hill, MA: TIMSS & PIRLS International Study Center, Boston College.
Mullis, I. V. S., Martin, M. O., Kennedy, A. M., & Foy, P. (2007). IEA’s Progress in International Reading Literacy Study in Primary School in 40 Countries. Chestnut Hill, MA: TIMSS & PIRLS International Study Center, Boston College.
Mullis, I. V. S., Martin, M. O., Foy, P., & Drucker, K. T. (2012b). PIRLS 2011 International Results in Reading. Chestnut Hill, MA: TIMSS & PIRLS International Study Center, Boston College.
Mullis, I. V. S., Martin, M. O., Foy, P., & Hooper, M (2016a). TIMSS 2015 – International Results in Mathematics. Fourth Grade Mathematics. Bosten: IEA.
Mullis, I. V. S., Martin, M. O., Foy, P., & Hooper, M (2016b). TIMSS 2015 – International Results in Mathematics. Fourth Grade Science. Bosten: IEA.
Mullis, I. V. S., Martin, M. O., Foy, P., & Hooper, M (2016c). TIMSS 2015 – International Results in Mathematics. Eight Grade Mathematics. Bosten: IEA.
Mullis, I. V. S., Martin, M. O., Foy, P., & Hooper, M (2016d). TIMSS 2015 – International Results in Mathematics. Eight Grade Science. Bosten: IEA.
Nattrass, N. (2008). AIDS and the scientific governance of medicine in post-apartheid South Africa. African Affairs, 107, 157-176.
Oesterdiekhoff, G. W. (2012a). The evolution of humanity from the childhood phase to adult maturity [Die Entwicklung der Menschheit von der Kindheitsphase zur Erwachsenenreife]. Berlin: Springer VS.
Oesterdiekhoff, G. W. (2012b). Was pre-modern man a child? The quintessence of the psychometric and developmental approaches. Intelligence, 40, 470-478.
Oesterdiekhoff, G. W. (2013). Ontogeny and history. The leading theories reconsidered. Cultural-Historical Psychology, 3, 60-69.
Oesterdiekhoff, G. W. (2016). Is a forgotten subject central to the future development of sciences? Jean Piaget on the interrelationship between ontogeny and history. Personality and Individual Differences, 98, 118-126.
Osman, H. A., Bakhiet, S. F. A., Alnaier, N. A. G., & Lynn, R. (2017a). A study of the intelligence of South Sudanese Refugee Children. Mankind Quarterly, 57, 585-589.
Osman, H.A., Bakhiet, S. F. A., Abduljabbar, A. S., Alnaier, N. A. G., & Lynn, R. (2018). A study of intelligence in the new nation of South Sudan. Mankind Quarterly, in press.
Raven, J. (1981). Irish and British Standardisations. Oxford: Oxford Psychologist Press.
Raven, J. (2000). The Raven’s Progressive Matrices: Change and Stability over Culture and Time. Cognitive Psychology, 41, 1-48.
Raven, J. (2008a). Coloured Progressive Matrices and Crichton Vocabulary Scale. London: Pearson.
Raven, J. (2008b). Standard Progressive Matrices and Mill Hill Vocabulary Scale. London: Pearson.
Raven, J., Raven, J. C., & Court, J. H. (1998). Manual for Raven’s Progressive Matrices and Vocabulary Scales. Oxford: Oxford Psychologist Press.
Raven, J., Raven, J. C., & Court, J. H. (2006). Manual zu Raven’s Progressive Matrices und Vocabulary Scales. Frankfurt: Harcourt Test Services.
Redfern, P. (2010, July 26th). Africa: Rising Number of Children Accused of ‘Crime of Witchcraft’. Retrieved from: https://allafrica.com/stories/201007261355.html
Rescher, N. (1993). Rationality: A Philosophical Inquiry into the Nature and the Rationale of Reason. [Rationalität. Eine philosophische Untersuchung über das Wesen und die Rechtfertigung von Vernunft]. Würzburg: Königshausen und Neumann.
Rindermann, H. (2006). Was messen internationale Schulleistungsstudien? [What do international student assessment studies measure? School performance, student abilities, cognitive abilities, knowledge or general intelligence?] Psychologische Rundschau, 57, 69-86.
Rindermann, H., & Carl, N. (2017). Indigenous Ecuadorian children: Parental education, parental wealth and children’s cognitive ability level. Learning and Individual Differences, 54, 202-209.
Rindermann, H., & Ceci, St. J. (2009). Educational policy and country outcomes in international cognitive competence studies. Perspectives on Psychological Science, 4(6), 551-568.
Rindermann, H., Falkenhayn, L., & Baumeister, A. E. E. (2014). Cognitive ability and epistemic rationality: A study in Nigeria and Germany. Intelligence, 47, 23-33.
Rodríguez, T. (2012). Environmental pesticide exposure and neurobehavioral effects among children of Nicaraguan agricultural workers. Ph.D thesis, University of Uppsala. Acta Universitatis Upsaliensis. Digital Comprehensive Summaries of Uppsala Dissertations from the Faculty of Medicine 820.
Sandiford, P., Cassell, J., Sanchez, G., & Coldham, C. (1997). Does intelligence account for the link between maternal literacy and child survival? Social Science & Medicine, 45, 1231-1239.
Stein, A. D., Behrman, J. R., DiGirolamo, A., Grajeda, R., Martorell, R., Quisumbing, A., & Ramakrishnan, U. (2005). Schooling, educational achievement, and cognitive functioning among young Guatemalan adults. Food and Nutrition Bulletin, 26, 46-54.
Tempe, J. (2019, Juni 7th). Five killed in Mozambique ‘for being bald’. Retrieved from: https://www.bbc.com/news/live/world-africa-39261633?ns_mchannel=social&ns_source=twitter&ns_campaign=bbc_live&ns_linkname=5937cde1e4b025bd1992528a%26Witchdoctors%20%27switch%20tactics%27%26&ns_fee=0#post_5937cde1e4b025bd1992528a
Tenkorang, E. Y., Gyimah, St. O., Tyndale, E. M. & Adjei, J. (2011). Superstition, witchcraft and HIV prevention in sub-Saharan Africa: the case of Ghana. Culture, Health & Sexuality, 13(9), 1001-1014.
The Associated Press (2007). Gambian president’s claim of AIDS cure causes alarm. Retrieved from: http://usatoday30.usatoday.com/news/health/2007-02-20-gambia_x.htm
Under The Same Sun (2019). Retrieved from: https://www.underthesamesun.com/content/academic-articles
Weihe, P., Hansen, J. C., Murata, K., Debes, F., Jørgensen, P. J., Steuerwald, U., White, R. F., & Grandjean, Ph. (2002). Neurobehavioral performance of Inuit children with increased prenatal exposure to Methylmercury. International Journal of Circumpolar Health, 61, 41-49.
Whaley, S. E., Sigman, M., Neumann, C., Bwibo, N., Guthrie, D., Weiss, R. E., Alberz, S. & Murphy, S. P. (2003). The Impact of Dietary Intervention on the Cognitive Development of Kenyan School Children. The Journal of Nutrition, 133, 3965S-3971S.
Wicherts, J. M., Dolan, C. V., & van der Maas, H. L. J. (2010). A systematic literature review of the average IQ of sub-Saharan Africans. Intelligence, 38, 1-20.